


On November 3, voters in 10 states decided dozens of local measures on data centers, and several wrote water into the law in gallons a day. The other stories are about measurement too: a cooling tower model that sets blowdown from live data, a statewide study of the shortest PFAS in New Jersey tap water, and the first entry in Below the Surface, a new weekly segment with one deeply researched fact about water quality. This page is the companion to our newsletter; each section stands alone.
Inside this week’s edition:
- Gallons on the ballot
- Run a cooling tower on data
- Short chain, long reach
- Below the Surface: one bottle, 600,000 liters
- By the numbers
- One good sign: PFAS treatment in Salem, New Jersey
Gallons on the Ballot
The results. Voters decided 47 local measures on data centers on November 3, in Ohio (21), Maine (8), Illinois (7), Kansas (4), New Jersey (2), and one each in California, Florida, Nevada, North Dakota and Wisconsin. Of the 46 with results posted by the evening of November 4, the side limiting data centers was ahead in 45. The median measure gave that side about 77 percent of the vote, and across all 258,201 votes counted the share was 72.8 percent. These are unofficial counts from Redbud Consulting’s Data Centers on the Ballot tracker, which reads county election results; six measures were still counting and nothing has been certified.
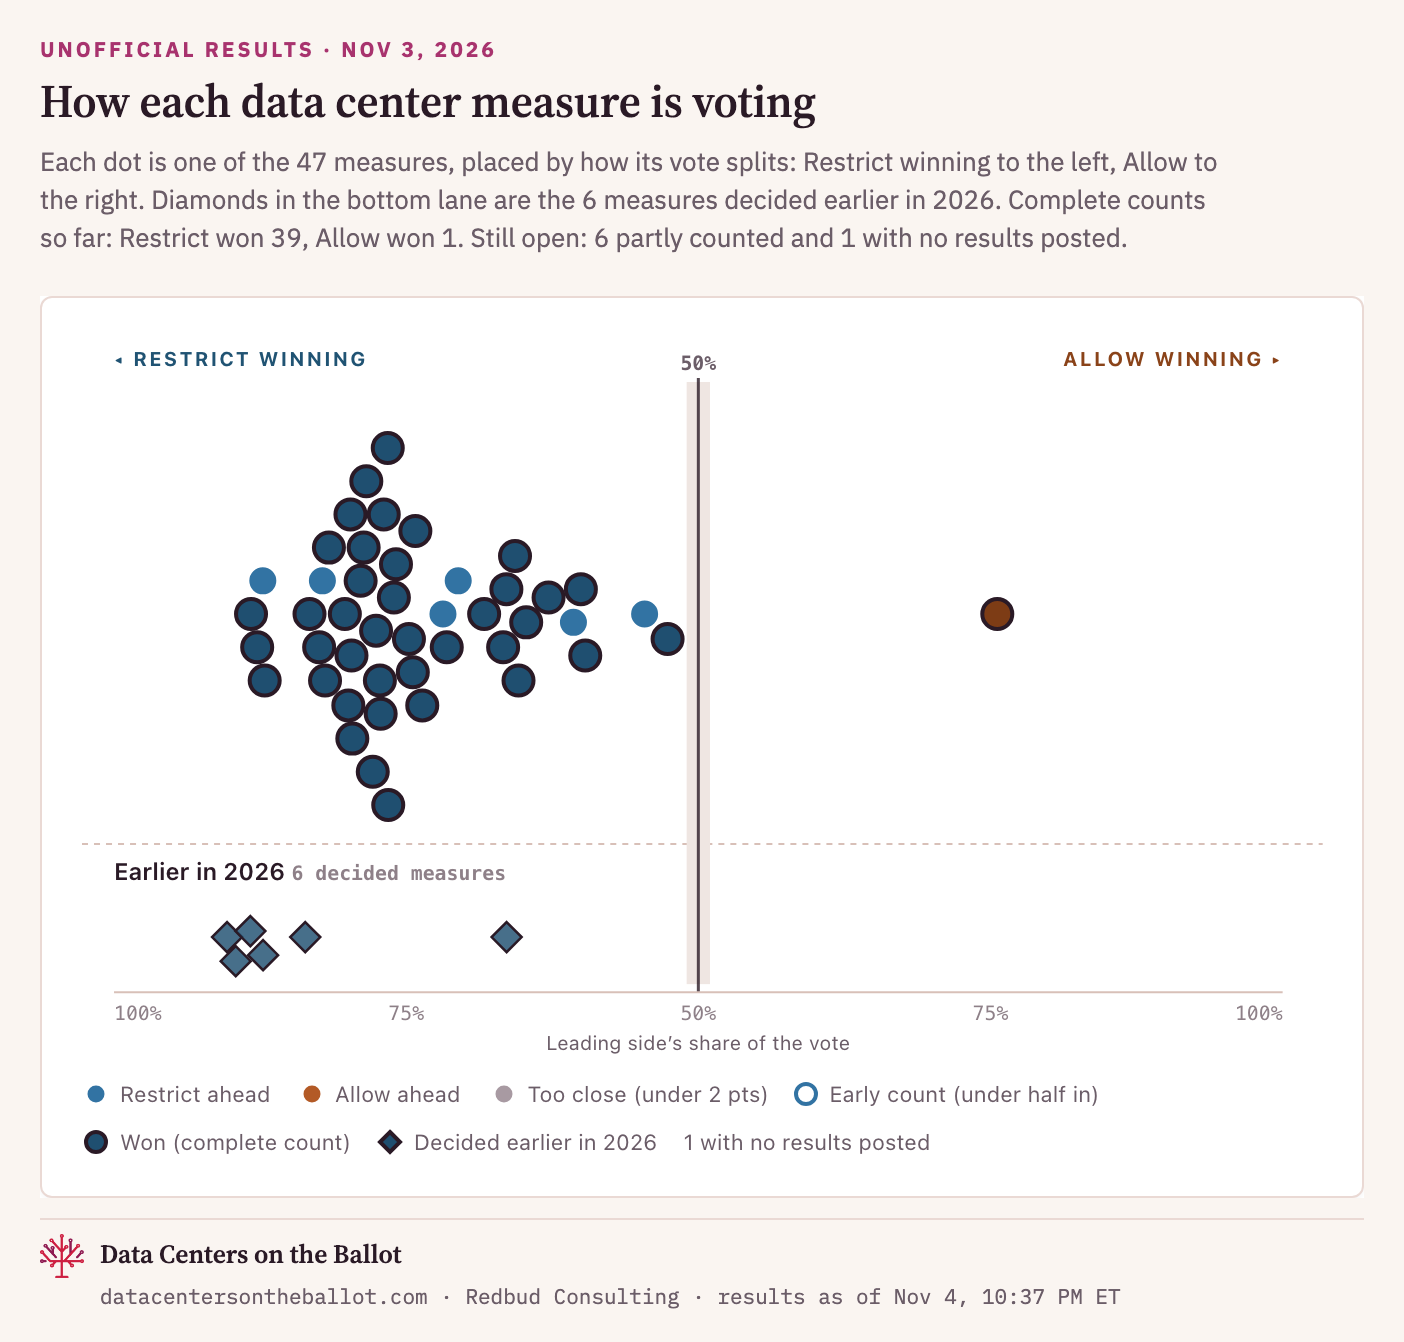
What was on the ballot. The measures were a mix: 13 charter amendments, 10 advisory questions with no binding effect, 7 moratoriums, and a range of zoning referendums and ordinances. On 13 of them a YES vote meant allowing a project, so the limiting side won by a NO. The tracker counts every measure by which way its outcome points, whatever the wording.
Water, written in gallons. Several measures defined a data center by the water it draws:
- Emporia, Kansas (60 percent, final): bans data centers drawing more than 10 megawatts of power or 100,000 gallons of water a day from every zoning district. It takes effect only after a court rules on the city’s challenge to the petition.
- El Dorado, Kansas (71 percent, final): a ten-year ban on “high impact” data centers, defined by the same 10 megawatt and 100,000 gallon thresholds, plus large battery storage.
- Grove City, Ohio (55 percent, still counting): any development over 50 acres, 20 megawatts or 500,000 gallons of water a day would need a citywide vote, with the developer paying for the election. It would put a proposed 300-acre data center to a vote.
- Peru, Maine (76 percent): a 180-day moratorium, partly to study the effect of data processing facilities on local water usage. No data center has been proposed there.
For scale. EPA’s WaterSense program says the average American family uses more than 300 gallons of water a day at home. The Kansas line of 100,000 gallons a day is roughly what 330 families use (100,000 ÷ 300 = 333).
The one exception. In Harwood, North Dakota, 76 percent of voters rejected a charter amendment that would have required a developer-paid independent review, a public hearing and written findings before approving industrial projects over 100 megawatts, 100 acres or 50,000 gallons of water a day.
The KETOS read. In September we wrote that when a question climbs the political ladder, measurement usually failed first, and that coverage of water was still climbing in our study of 103,341 data center news articles. This week it reached the ballot. A gallons-a-day threshold in a city ordinance assumes that someone can read the gallons, every day, in a form a city clerk and a skeptical resident will both accept. Operators who meter intake, blowdown and discharge continuously, and publish the numbers in a form that can be audited, give towns numbers they can check before they vote.
Sources: Redbud Consulting, Data Centers on the Ballot, 2026 results (datacentersontheballot.com; data as of November 4, 2026, 10:37 p.m. ET; unofficial); ballot language as compiled by the tracker from county boards of elections; EPA WaterSense, “How We Use Water”; KETOS, Datacenter Media Sentiment (2026), data via the GDELT Project.
Run a Cooling Tower on Data
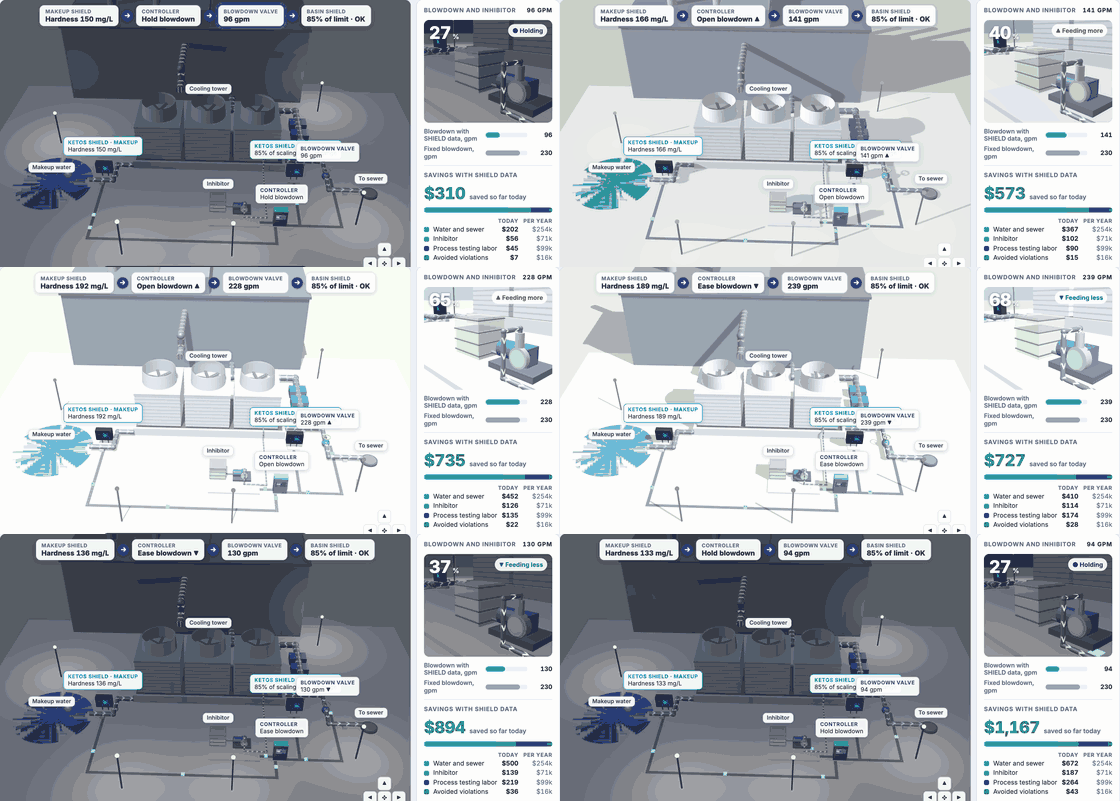
What it shows. H2ROI, the KETOS interactive calculator, includes cooling tower blowdown. A cooling tower’s blowdown is water a plant bought, treated and paid to discharge. In the model, two KETOS SHIELDs, on the makeup water and in the tower basin, give the blowdown controller conductivity every minute and hardness every hour, so the tower runs as many cycles of concentration as the water allows.
How it works. At night the makeup water is soft, and a fixed blowdown rate would dump far more water than the tower needs, so the controller eases blowdown back and raises cycles. In the morning the load picks up, evaporation rises and the tower draws more makeup water. When the makeup source turns harder, the makeup SHIELD sees it first and the controller opens the blowdown to keep the basin below its scaling limit. A fixed rate would have pushed the basin past that limit in the afternoon and wasted water the rest of the day.
What it models. Enter tower evaporation, makeup water hardness, the basin scaling limit, today’s fixed blowdown, water and sewer costs, and inhibitor dose and price. H2ROI estimates water and sewer saved, inhibitor saved, and the process testing and violations avoided. The model is set in a steel mill, and the cycles-and-blowdown arithmetic is the same for any evaporative cooling tower, a data center’s included.
Try it: ketos.co/h2roi.
Concerned about contaminants in your water?
Get water testing from KETOS KELP using EPA-certified methodology, results you can trust, backed by real data.
Order a Water Test →Short Chain, Long Reach
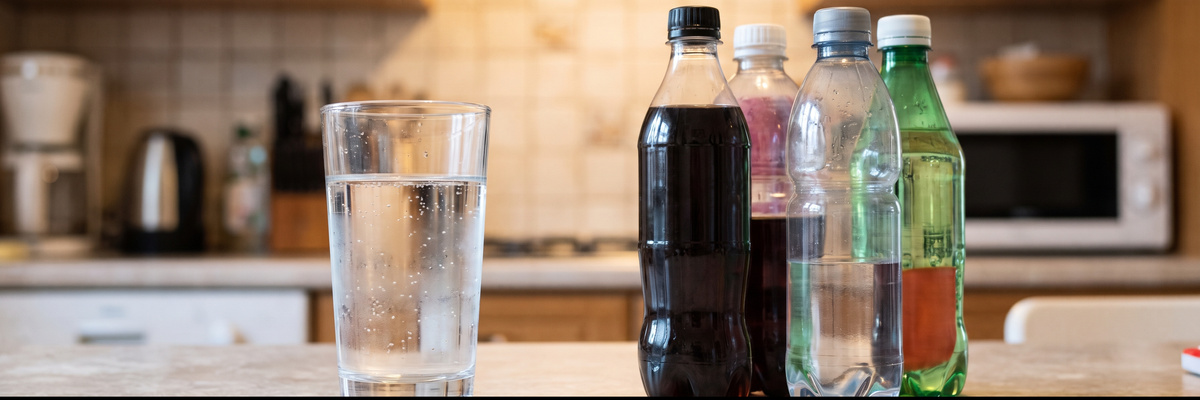
The study. A team at the New Jersey Institute of Technology (Gu, Venkatesan and colleagues) screened 113 samples for five ultra-short-chain PFAS: 70 tap water samples from all 21 New Jersey counties and 43 bottled beverages. The paper, published online in Environmental Science & Technology Letters in September 2026, is described by its authors as the first statewide monitoring study of these compounds in the United States.
Why these compounds are different. Ultra-short-chain PFAS have one to three carbons. The authors describe them as highly mobile, persistent, and difficult to monitor using conventional PFAS workflows.
What it found. Trifluoroacetic acid (TFA) was the dominant compound. It was found in 91.4 percent of tap water samples, at 74.0 to 1,360 ng/L, and in 79.1 percent of bottled beverages, at 59.6 to 94,100 ng/L. Formulated beverages (12 samples) averaged 15,400 ng/L, against 295 ng/L for bottled water (31 samples), a 52-fold difference. Three other ultra-short-chain PFAS turned up less often, and one (PFMeS) was not detected.
What it doesn’t say. The study measured occurrence. It did not assess health effects, and the authors call for coordinated national surveys.
The KETOS read. A PFAS result covers the compounds on the method’s target list. A utility asking about PFAS can ask its lab which compounds the method covers, and whether short-chain compounds like TFA are in scope, before reading a clean report as a clean water supply.
Sources: Gu, Chitthaluri, Etsiwah, Pandey and Venkatesan, “Occurrence of Ultra-Short Chain PFASs in Bottled Beverages and New Jersey Tap Water,” Environmental Science & Technology Letters (2026), doi:10.1021/acs.estlett.6c00768; NJIT news release (October 2026).
Below the Surface: One Bottle, 600,000 Liters
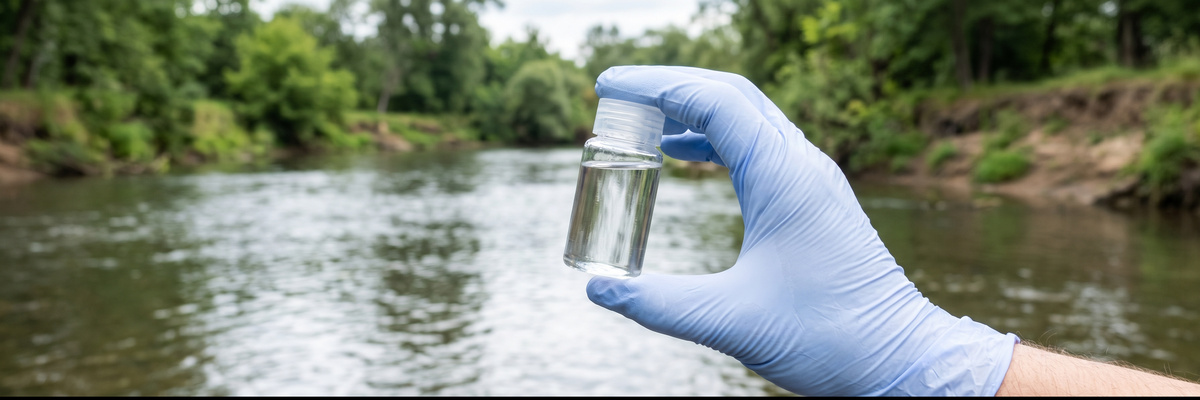
The fact. Under federal rules, a community water system serving 25 to 1,000 people must take at least one total coliform sample a month, and a state may reduce that to one sample a quarter for a system with a clean record, but never lower. The standard sample is 100 mL, and the lab reports only whether coliforms are present or absent.
The arithmetic. At a planning figure of 2 liters of drinking water per person per day:
- A town of 1,000 drinks 1,000 × 2 × 30 = 60,000 liters a month. One 100 mL sample is 1 part in 600,000 of that.
- Each resident’s share of the sample is 100 mL ÷ 1,000 = 0.1 mL, about two drops.
- On a quarterly schedule, the bottle stands for 180,000 liters, 1 part in 1.8 million.
- A city of 4 million falls in the top tier, at least 480 samples a month. That is 48 liters of samples for 240 million liters drunk, or about a quarter of a drop per resident.
Why it matters. Sampling effort per person shrinks as systems grow: one sample per 1,000 people in the smallest tier, one per 8,333 in the largest. A coliform sample works as a sentinel. It catches contamination that is widespread or persistent enough to show up in a few bottles.
What else gets checked. These are minimums, and many utilities sample well above them. Systems that treat surface water also monitor turbidity and disinfectant residual under separate rules, and a positive coliform result triggers repeat samples.
The KETOS read. Grab samples answer a yes-or-no question at one place and one moment. Continuous measurements of residual, turbidity and conductivity fill the hours between bottles, and show an operator when to take the next one.
Sources: 40 CFR 141.21(a)(2) and (f)(1), total coliform monitoring frequency and sample volume (eCFR, current as of November 2026); the Revised Total Coliform Rule (40 CFR 141 Subpart Y) carries these routine schedules forward.
By the Numbers
- 45 of 46: local data center measures with results where the side limiting data centers led on November 4 (Redbud Consulting, unofficial)
- 258,201: votes counted across those measures (same)
- 91.4 percent: New Jersey tap water samples with TFA (Gu et al.)
- 52 times: average TFA in formulated drinks versus plain bottled water (same)
- 100 mL: the monthly coliform sample required of a town of 1,000 (40 CFR 141.21)
One Good Sign: PFAS Treatment in Salem, New Jersey
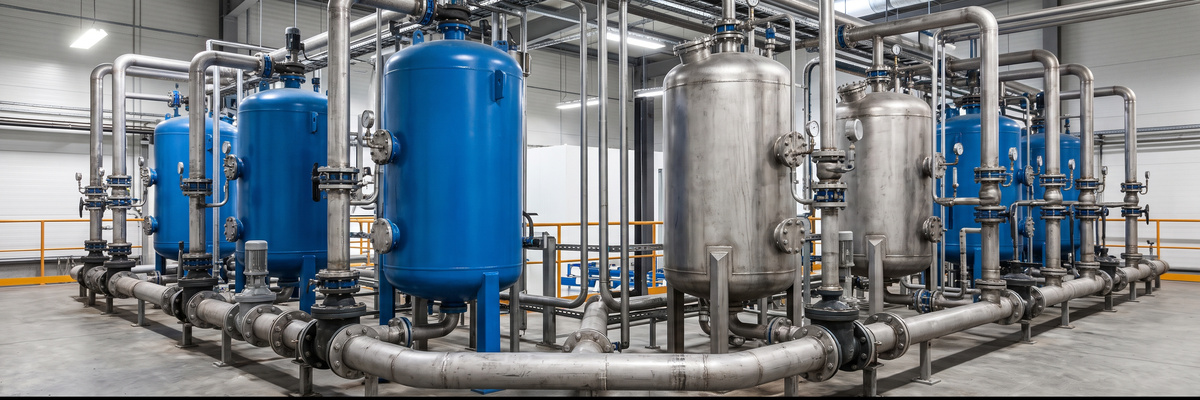
What changed. On October 27, New Jersey American Water and Salem City marked the completion of a $21.3 million PFAS treatment project at the Salem Water Treatment Plant. When the company acquired the system in June 2024, it was not meeting the applicable drinking water regulations for PFAS.
How it works. The plant uses granular activated carbon in six treatment vessels arranged in three treatment trains, and can treat up to 2 million gallons a day. Construction began in spring 2025, the treatment went into service in November 2025, and the building housing it was finished in summer 2026. The plant serves the City of Salem and parts of Quinton, Elsinboro and Mannington townships.
Sources: New Jersey American Water news release (October 27, 2026); ROI-NJ (October 28, 2026).
KETOS builds continuous water-quality monitoring for utilities and industry. If a story here touched a problem you own, we would like to hear how you see it: reply to the newsletter, or find us at ketos.co.