


A century of US river records shows how few rivers anyone has sampled, and at what hours. The other stories stay with what gets measured and when: a farm model that credits the nitrate already in its well water, two very different PFAS numbers, a boil order in Missouri that started with one float, what Ohio’s sewage says about its towns, and John Snow’s 1854 table of cholera deaths by water company. This page is the companion to our newsletter; each section stands alone.
Inside this week’s edition:
- The rivers nobody sampled
- Credit the nitrate in the well
- PFAS detected for 197 million
- One float, one boil order
- What sewage says about a town
- Below the Surface: 315 deaths versus 37
- By the numbers
- One good sign: Rib Mountain’s new plant
The Rivers Nobody Sampled

The finding. Fewer than 1 percent of the roughly 24 million river segments in the United States have ever been sampled for water quality. A University of Florida team reached that figure by assembling about 50 million observations of 11 water-quality constituents, a record that runs from 1925 to 2022.
What the record shows.
- Growth, then decline. The number of samples taken each year rose by four orders of magnitude between 1925 and 2010, then fell about 40 percent by 2022. The study did not investigate why.
- Big rivers first. Sampling leans heavily toward larger streams. “Almost none of the small rivers have ever been sampled in U.S. history,” said co-author James Jawitz.
- Summer, midday. Samples cluster in summer, around the middle of the month and in the middle of the day, and the seasonal skew is strongest at higher latitudes.
- One visit, mostly. Many locations have a single recorded observation, and only a small number of sites hold the consistent long-term records needed to track a trend.
- States differ. Sampling intensity varies widely by constituent and by state. Florida stands out, and devotes the highest share of its effort to small streams of any state.
What the authors say it means. Lead author Nicolas Fernandez said the results are not necessarily an argument for sampling every river equally, and that they offer a basis for rethinking how monitoring is designed.
The KETOS read. A sample taken at midday in summer describes a river at midday in summer. Continuous sensors at a few well-chosen points record the nights, the storms and the winter months that a sampling calendar rarely reaches, and they show where the next grab sample will tell a program the most.
Sources: Fernandez, Zuccolotto, Lucchese, Slevin, Godavarthy, Gardner, Cohen and Jawitz, “A century of water quality sampling in rivers of the United States,” Communications Earth & Environment (August 4, 2026), doi:10.1038/s43247-026-03881-6; UF/IFAS news release (November 3, 2026).
Credit the Nitrate in the Well
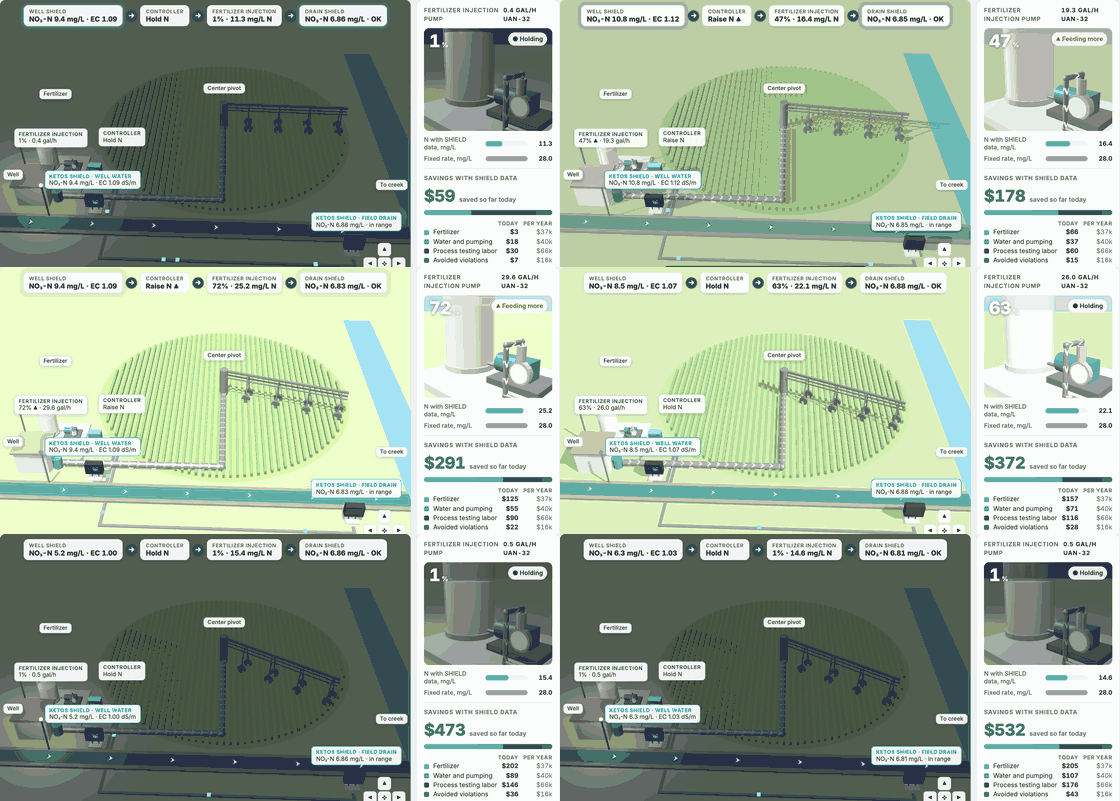
What it shows. H2ROI, the KETOS interactive calculator, includes a center-pivot farm. Well water often carries nitrogen of its own. In the model, two KETOS SHIELDs, one on the well water and one on the field drain, report conductivity every minute and nitrate every hour, so the fertigation controller injects only what the crop needs.
How it works. At night the pivots are off and the drain SHIELD keeps watch on nitrate leaving the field. When irrigation starts, the well SHIELD measures how much nitrate the water already carries, and the controller credits it against the crop’s needs. In the afternoon the well pumps water with more nitrate, the well SHIELD sees it, and the controller cuts the injection. A fixed injection rate would have pushed drain nitrate above the runoff limit.
What it adds up. The savings panel tallies fertilizer, water and pumping, process testing labor, and avoided violations, for the day and for the year.
Try it: ketos.co/h2roi.
Concerned about contaminants in your water?
Get water testing from KETOS KELP using EPA-certified methodology, results you can trust, backed by real data.
Order a Water Test →PFAS Detected for 197 Million
The new count. The Environmental Working Group analyzed EPA and state testing data and found PFAS in water systems serving an estimated 197 million people, 23 million more than earlier federal testing showed. The count includes systems where PFAS were detected at any level, not only those above the federal limits.
EPA’s own number. EPA released the final dataset from its fifth Unregulated Contaminant Monitoring Rule (UCMR 5) in August 2026, covering 29 PFAS sampled from 2023 to 2025. Its summary estimates that 7.8 percent of public water systems nationwide had at least one sampling-location average above a PFAS maximum contaminant level. By size, that was 15.5 percent of systems serving more than 10,000 people, 8.3 percent of those serving 3,300 to 10,000, and 7.1 percent of those serving fewer than 3,300.
How to read the two. The 197 million covers everyone served by a system with any detection, so it runs far larger than EPA’s count of systems with an average above a limit. EPA notes that UCMR 5 results do not indicate compliance or noncompliance: compliance is judged on running annual averages from each system’s own monitoring.
The deadline. In May 2026, EPA proposed letting drinking water systems request two more years, to 2031, to meet the PFOA and PFOS limits. As of this issue, the extension is still a proposal.
The KETOS read. A utility’s own PFAS question is narrower than either national number: which compounds are in its water, at which sampling points, and how the running average is moving quarter to quarter. Systems that track that trend early have the most time to choose a treatment approach.
Sources: EPA, UCMR 5 Data Summary (EPA 815-S-26-007) and UCMR 5 Data Finder; EPA, PFAS National Primary Drinking Water Regulation page (proposed rules of May 18, 2026); Environmental Working Group analysis as reported by WRAL (November 6, 2026).
One Float, One Boil Order
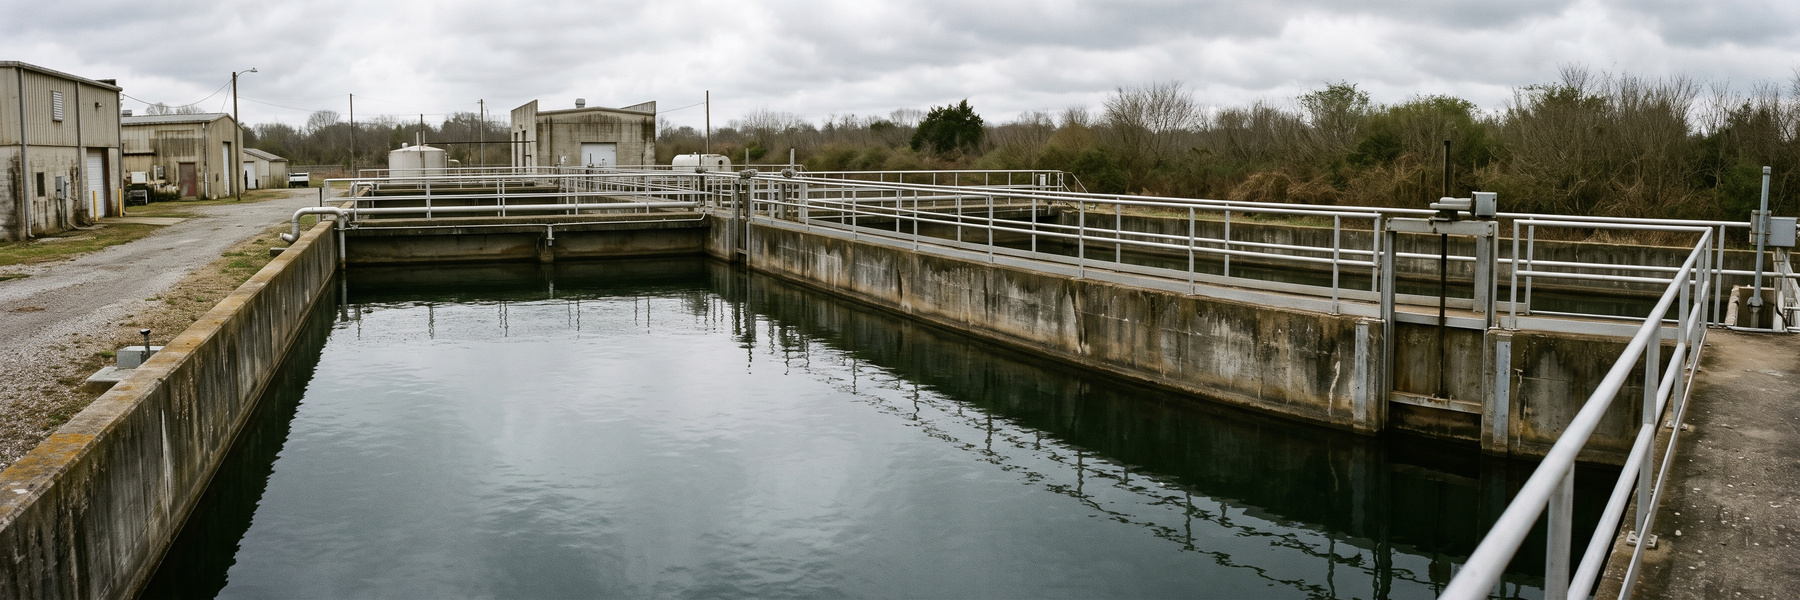
What happened. Around 10 a.m. on Sunday, November 8, a float failed at the water treatment plant in West Plains, Missouri. The failure shut down the polymer feed machine that helps remove sediment before water is filtered, and turbidity rose briefly.
What followed. The city first issued a citywide boil water advisory, then upgraded it the same day to a boil water order covering every customer on the city system. Crews repaired the float and turbidity returned to its normal operating range. The city sent samples to the state lab in Jefferson City and said no bacteria had been confirmed. On November 12, the Missouri Department of Natural Resources lifted the order after both sets of samples came back satisfactory.
The KETOS read. Turbidity is the plant’s fastest signal that coagulation has gone wrong, and the bacterial samples that clear a boil order take a day or more to come back. Continuous readings before and after filtration give operators a record of exactly when a problem started and when the water came back in range.
Sources: KY3 (November 8, 9 and 12, 2026), citing City of West Plains utilities; Ozark Radio News (November 12, 2026).
What Sewage Says About a Town
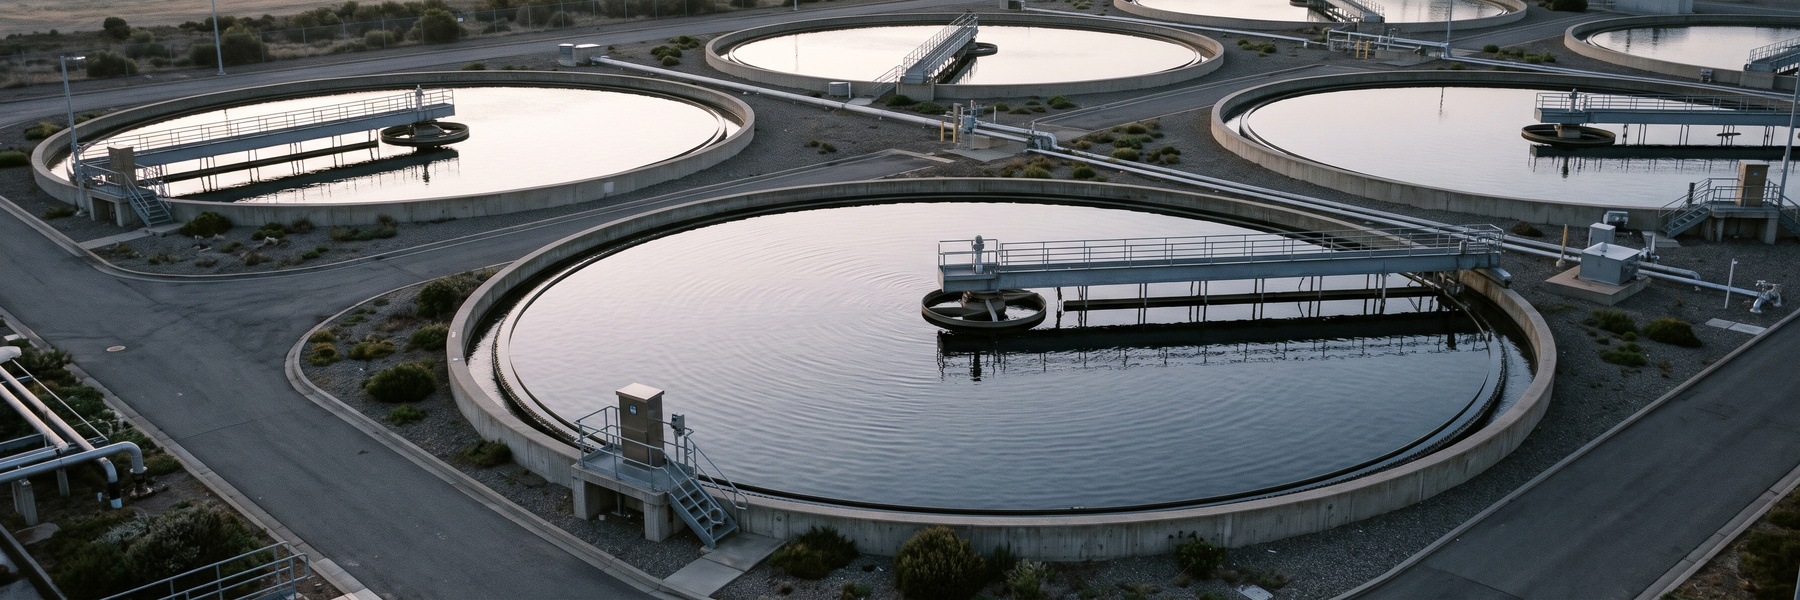
The study. Researchers at Ohio State University profiled the human gut bacteria in 27 wastewater samples, collected in May and June 2022 from nine treatment plants in eight Ohio cities that together serve more than 1.3 million people. They compared each community’s bacterial profile with public health, lifestyle, socioeconomic and demographic data.
What it found. Firmicutes, Desulfovibrio, Acetobacterium and overall bacterial diversity were significantly associated with indicators of chronic disease burden, and with smoking, obesity and unemployment. Rural communities showed higher levels of these bacteria and of several chronic conditions.
What it doesn’t say. The design is retrospective and cross-sectional, so the results are associations at the community level. Senior author Jiyoung Lee described wastewater as a way to understand the health of whole communities, beyond the people who show up in clinics.
Sources: Lancaster and Lee, “Wastewater-based human gut microbiome surveillance links microbial signatures to population health in Ohio communities,” Environmental Research 306:125332 (2026), doi:10.1016/j.envres.2026.125332; Ohio State University news release (November 10, 2026).
Below the Surface: 315 Deaths Versus 37
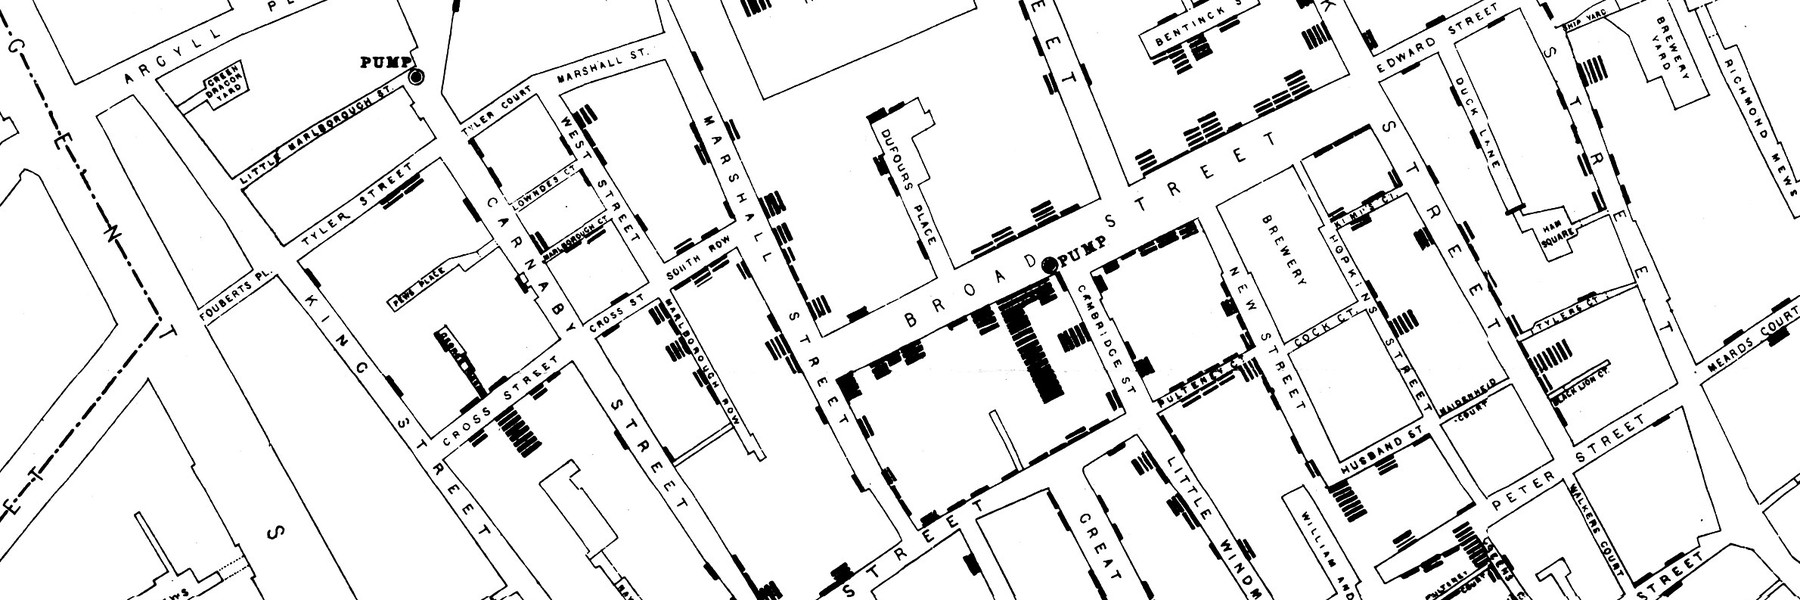
The fact. In the first seven weeks of London’s 1854 cholera epidemic, John Snow tabulated deaths by which water company supplied each house. Houses supplied by the Southwark and Vauxhall Company recorded 1,263 deaths in 40,046 houses, or 315 per 10,000. Houses supplied by the Lambeth Company recorded 98 deaths in 26,107 houses, or 37 per 10,000.
The arithmetic.
- 1,263 ÷ 40,046 = 315 deaths per 10,000 houses.
- 98 ÷ 26,107 = 37.5 deaths per 10,000 houses.
- 315 ÷ 37.5 = 8.4, so a Southwark and Vauxhall house was about eight times as likely to record a death.
- At Lambeth’s rate, Southwark and Vauxhall’s houses would have recorded about 150 deaths. The other 1,100 or so line up with the company that piped the water.
Why it holds up. The two companies served the same neighborhoods. In Snow’s words, “The pipes of each Company go down all the streets,” and in many cases a single house had a different supply from the houses on either side. Rich and poor, large houses and small, drew from both, so the main difference between the two groups was the water.
The unit. The rates are per house, not per person, since Snow had house counts by company.
The KETOS read. Snow pointed at the water decades before the cholera germ was widely accepted, using counts that any parish clerk could check. Measurement often arrives before the mechanism, and a clean, well-organized record is what lets it point in the right direction.
Sources: John Snow, On the Mode of Communication of Cholera, 2nd edition (1855), Table IX and accompanying text (Project Gutenberg 72894). Map: John Snow, 1854, public domain.
By the Numbers
- Fewer than 1 percent: US river segments ever sampled for water quality, of about 24 million (Fernandez et al.)
- About 40 percent: drop in annual US river sampling from 2010 to 2022 (same)
- 197 million: people served by water systems with PFAS detected (EWG)
- 7.8 percent: public water systems with at least one PFAS sampling average above a federal limit (EPA estimate, UCMR 5)
- 1.3 million: Ohioans covered by the 27 wastewater samples in the Ohio State study
One Good Sign: Rib Mountain’s New Plant
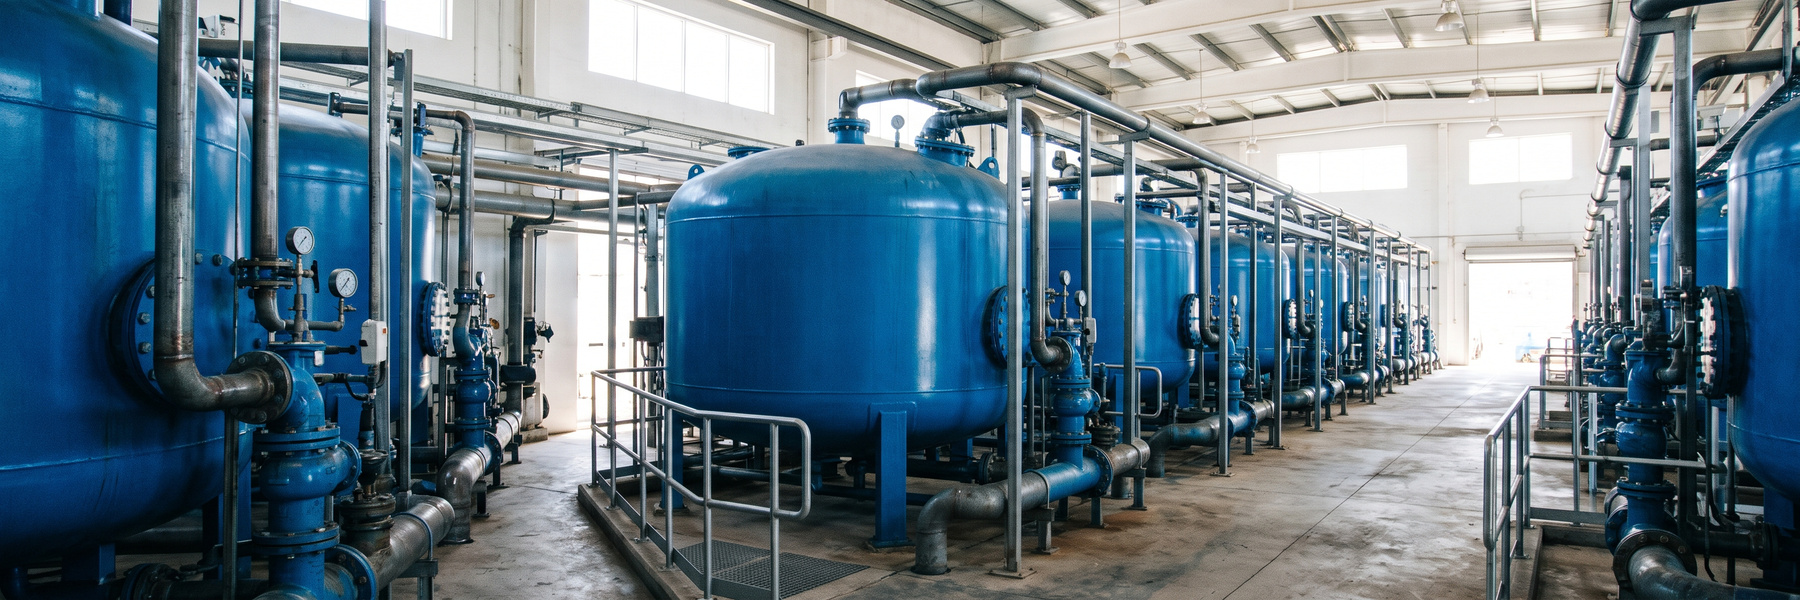
What changed. On October 28, the Village of Rib Mountain, Wisconsin, held a ribbon cutting for its new water treatment plant. All of the village’s wells moved to the plant in July 2026, and all of its water is now treated for iron, manganese and PFAS.
How it works. The plant uses large carbon vessels. Utility director Mike Heyroth said the project cost $14.3 million, paid for by ratepayers and grants from EPA and the Wisconsin Department of Natural Resources, and that residents will “see a lot better water quality.”
Sources: Village of Rib Mountain, Water Quality Improvements (October 2026 update); WSAW (October 28, 2026).
KETOS builds continuous water-quality monitoring for utilities and industry. If a story here touched a problem you own, we would like to hear how you see it: reply to the newsletter, or find us at ketos.co.