


KETOS Research
World Environment Day 2026 is themed around climate action. Most of that conversation runs in carbon and degrees, but for the people who manage, regulate, and depend on water systems, climate arrives first through the tap. Hotter, drier years concentrate contaminants in shrinking source water, and heavier storms push more runoff through treatment plants that were never sized for it. Water quality is where a great deal of climate stress actually lands, so it is a fitting day to take stock of US water quality and where US drinking water stands. The honest answer is that the picture is genuinely mixed, and both halves of it are worth sitting with.
The good news: we can finally see the problem
For most of the history of US drinking water, the country has lacked a complete picture of what is actually in the water. That changed this year.
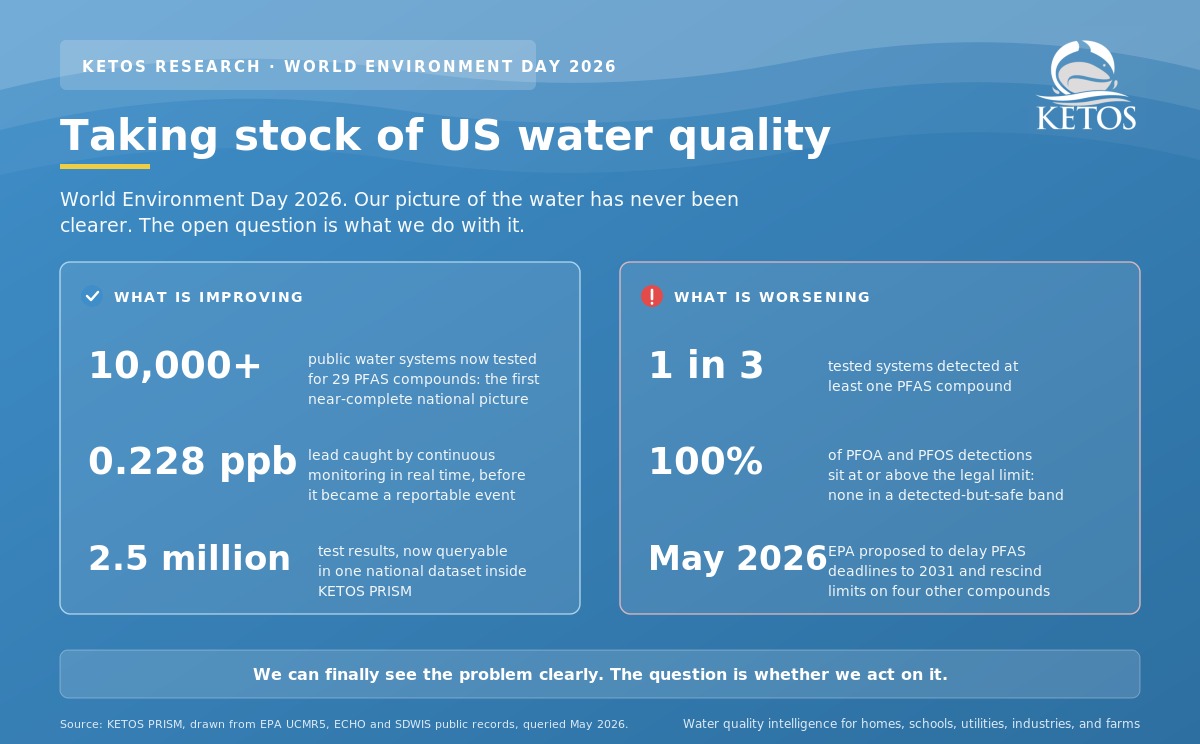
EPA’s fifth Unregulated Contaminant Monitoring Rule, known as UCMR5, required community water systems serving more than 3,300 people, plus a representative national sample of smaller ones, to test finished drinking water for 29 PFAS compounds. That monitoring window has now closed, and the result is the first near-complete national view of forever chemicals in American drinking water: roughly 2.5 million test results across more than 10,000 public water systems, collected between 2023 and 2025.
At KETOS, we pulled that entire corpus into PRISM, our water intelligence platform, so the full national record can be queried in one place rather than scattered across thousands of individual reports. A decade ago this dataset did not exist in any usable form. The single most important fact about US water quality in 2026 may simply be that we can now measure it at national scale. You cannot fix what you cannot see.
Measurement at the local level has improved just as quickly. Continuous, real-time monitoring now does work that periodic grab-sampling never could. At one school site running KETOS SHIELD, 140 days of continuous chemistry monitoring produced 596,000 data points and flagged lead at 0.228 parts per billion well before it became a reportable event. That is the version of water safety worth building toward: problems caught early and quietly, at fractions of a part per billion, before anyone drinks them.
The hard news: what the measurements show
The same dataset that gives us the clearer view also delivers the uncomfortable findings.
Of the systems tested under UCMR5, roughly one in three has detected at least one PFAS compound. About 17 percent are above the federal limit for PFOA or PFOS, the two most-studied and most-regulated forever chemicals.
The detail that stays with us is the shape of those detections. Across the more than 11,000 PFOA and PFOS detections recorded nationwide, effectively every single one came in at or above the 4-parts-per-trillion federal limit. There is no meaningful band of readings that are detected but comfortably safe. Part of that is structural, because the lowest concentration a certified lab is required to report for these two compounds is set at the same level as the legal limit. The practical consequence is blunt: for PFOA and PFOS, the act of measuring them and the act of confirming an exceedance have become nearly the same thing.
Detection also varies sharply by geography. In the states with the highest rates, more than 60 percent of tested systems show PFAS, with New Jersey and Connecticut at the top of the range. Where your water comes from shapes your exposure, which is why a national average is only ever a starting point.
Concerned about contaminants in your water?
Get water testing from KETOS KELP using EPA-certified methodology, results you can trust, backed by real data.
Order a Water Test →The response is moving the other way
The tension that defines this World Environment Day is that just as the data has become clear enough to act on, the federal rules built to act on it are loosening.
On May 18, 2026, the EPA proposed two changes. The first would let water systems request additional time, pushing the PFOA and PFOS compliance deadline out to 2031. The second would rescind the drinking water limits set in 2024 for four other PFAS, including the GenX chemicals. The underlying PFOA and PFOS limits of 4 parts per trillion remain in place under the proposal, but the timeline to meet them stretches, and the regulatory net around the wider PFAS family narrows. The public comment period is open until July 20, 2026.
The enforcement backdrop is its own caution. When we built EPA’s public enforcement records into PRISM, 45 percent of facilities under formal Clean Water Act enforcement since 2020 turned out to have been assessed no monetary penalty at all. A clear picture of a problem does not automatically produce a forceful response to it.
Where US water quality stands now
Taken together, the two halves point to a single conclusion. Our instruments have never been sharper and our national data has never been more complete. We can map PFAS across the country system by system and catch lead at fractions of a part per billion in real time. The open question for US water quality is no longer whether we can see it clearly. It is whether we will act on what we now see.
That question gets answered one water system, and one household, at a time. If you manage a public system, the UCMR5 results for your service area are part of the public record. If you are a homeowner or a renter, you can check the PFAS grade for your zip code to understand the risk in your area, and a direct test with KETOS KELP turns that area-level forecast into a documented answer for your own tap. A map is a forecast, and a measurement is the answer.
World Environment Day is a good week to take that first look.
Frequently asked questions
How many US public water systems have detected PFAS?
Under EPA’s UCMR5 national monitoring (2023 to 2025), roughly one in three tested public water systems detected at least one PFAS compound, and about 17 percent were above the federal limit for PFOA or PFOS. Source: KETOS PRISM, UCMR5 national record.
When PFOA or PFOS is detected, is it usually over the legal limit?
In the national record, effectively all of the more than 11,000 PFOA and PFOS detections came in at or above the 4-parts-per-trillion federal limit, with essentially none below it. For these two compounds, detecting them and confirming an exceedance have become nearly the same act.
What did the EPA propose for PFAS in May 2026?
On May 18, 2026, the EPA proposed to let water systems extend their PFOA and PFOS compliance deadline to 2031 and to rescind the 2024 drinking water limits for four other PFAS, including GenX. The 4-parts-per-trillion PFOA and PFOS limits remain in place; the public comment period is open until July 20, 2026.
Sources and methodology
- PFAS detection and exceedance figures: KETOS PRISM, drawn from EPA’s UCMR5 national record (2023 to 2025), queried May 2026.
- EPA Proposed PFOA and PFOS Compliance Extension Rule and Proposed PFAS Rescission Rule, announced May 18, 2026; public comment open through July 20, 2026.
- Clean Water Act enforcement figures: KETOS PRISM, built on EPA ECHO and SDWIS public records.
- Continuous monitoring example: KETOS SHIELD deployment, 140 days, 596,000 data points.
