


KETOS has a new platform called KETOS PRISM. KETOS PRISM is an environmental intelligence platform that sources, aggregates, and analyzes publicly available environmental data from various sources, including the EPA, USGS, NOAA, and NASA.
KETOS PRISM is designed to help researchers, pre-development construction teams, engineers, public policy offices, and law firms quickly find the latest environmental data based on geographic location. One such area of high interest for many is PFAS insights, and, using PRISM, KETOS researchers have been able to delve into PFAS to uncover contamination concentrations and implications for public health and policy officials.
This is Part Two of a multi-part series on PFAS based on our latest comprehensive report: PFAS Contamination in the US. You can read Part One here.
Understanding UCMR 5
Unregulated Contaminant Monitoring Rule 5 (UCMR 5) is a program organized by the United States Environmental Protection Agency (EPA) to collect data on contaminants with a suspected presence in drinking water but do not yet have health-based standards under the Safe Drinking Water Act (SDWA). The program is designed to help the EPA determine the frequency and levels of these contaminants in public water systems (PWS) across the country, which can inform future regulatory actions.
The UCMR 5 focuses explicitly on collecting data on 30 compounds, including 29 Per- and Polyfluoroalkyl Substances (PFAS) and lithium. The data collected through this program, covering the years 2023-2025, will help assess the potential health risks these contaminants pose and guide decisions on whether they should be regulated in the future.
Why UCMR 5 Matters to Public and Private Organizations
It is vital for utilities and businesses to understand the need for and impact of UCMR 5 for several reasons:
Regulatory Compliance and Preparedness
Public water systems are required to monitor and report the presence of the contaminants listed under UCMR 5. This helps utilities ensure compliance with potential future regulations and avoid penalties. It also allows them to prepare for stricter water quality standards that may be implemented based on the data collected.
Industries that rely on high-quality water for their operations, such as food and beverage, manufacturing, and pharmaceuticals, must be aware of potential contaminants in their water supply. UCMR 5 data can alert businesses to emerging water quality issues, enabling them to proactively protect their operations and ensure product safety.
Public Health and Safety
The data collected under UCMR 5 provides utilities with valuable insights into the presence of potentially harmful contaminants in their water supply. This enables them to take steps to protect public health by identifying and mitigating risks, such as investing in treatment technologies or improving infrastructure.
Companies prioritizing environmental responsibility and consumer safety can use UCMR 5 data to ensure their water usage aligns with public health goals. This can enhance their reputation and meet the expectations of increasingly environmentally conscious customers and stakeholders.
Risk Management and Liability
By staying informed about the presence of unregulated contaminants, utilities can better manage risks related to water quality. This includes minimizing potential liabilities associated with providing contaminated water, which could lead to legal action or reputational damage.
For industries that may discharge contaminants into water sources, understanding UCMR 5 data can help them anticipate regulatory changes and reduce liability risks. Compliance with environmental standards can also prevent costly fines and sanctions.
Financial Implications
The cost of treating water to remove contaminants detected through UCMR 5 can be significant. However, by identifying contaminants early, utilities can plan for and invest in the necessary technologies, potentially saving money in the long term and avoiding emergency expenditures.
Companies may face increased costs if water supplies are contaminated, such as expenses for additional filtration, sourcing alternative water supplies, or halting production. Proactively using UCMR 5 data can help businesses mitigate these financial risks.
Influence on Future Regulations
The data from UCMR 5 will inform future regulatory decisions by the EPA. Utilities and businesses that engage with this data can shape future regulations by providing feedback or participating in advocacy efforts. Being prepared for potential regulatory changes can give them a competitive advantage.
UCMR 5 matters for utilities and businesses because it enables them to manage risks, ensure compliance, protect public health, and prepare for future regulatory developments.
Concerned about contaminants in your water?
Get water testing from KETOS KELP using EPA-certified methodology, results you can trust, backed by real data.
Order a Water Test →PFAS and UCMR 5
The UCMR 5 dataset contains measurements for dozens of PFAS chemicals. In our reporting, we focused on five in particular that are included in the new rules laid down by the EPA in April of 2024:
- PFOA (PerFluoroOctanoic Acid)
- PFOS (PerFluoroOctaneSulfonic Acid)
- PFNA (PerFluoronoNanoic Acid)
- PFHxS (PerFluoroHexaneSulfonic Acid)
- HFPO-DA (HexaFluoroPropylene Oxide Dimer Acid)
Through 2023 and 2024, a total of 23,546 measurements of each type of PFAS chemical were conducted and recorded (as of September 2024) in the UCMR 5 dataset.
The measurements are detectable (Non-null values) and undetectable (numerical values), respectively.
KETOS PRISM: Digging Into PFAS Datasets
Detectable Levels of PFAS in the US
Our analysis interprets undetectable measurements as equal to zero parts per trillion (0 ppt) concentration uniformly. The table below shows that up to 6.7% (roughly one out of every 15 to 16) measurements had a detectable value of a PFAS chemical.
Out of the 4,610 unique PWS systems at which samples were taken:
- 889 locations (roughly 16%, or one in six) had at least one detectable PFAS measurement.
- 702 (approximately one in seven) locations had two or more detectable PFAS measurements of multiple contaminants.
Given the health risk compounds with the co-occurrence of “forever chemicals”, the plurality of locations with at least one PFAS chemical compound and two co-occurring PFAS chemicals is a concerning insight.
The Maximum Values for Each PFAS Contaminant
We also examined the maximum values measured for each contaminant in the dataset. Given that acceptable values for each PFAS ranged from four parts per trillion to 10 parts per trillion (0.004 μg/l to 0.01 μg/l), it would help determine the maximum extent of excess PFAS exposure in the US. Maximum values recorded in the dataset for each contaminant, along with the county and state information, are shown here:
While it isn’t possible to determine the period of sustained exposure from the data provided, the fact that the maximum exposure of 59X or 5800% (59 times the maximum acceptable PFOA value) occurred anywhere in the US is an alarming statistic. From a public health policy perspective, given that PFAS in the US has been an unregulated contaminant until now, it might be prudent to assume the worst in such situations.
The Distribution of Detectable Levels of Forever Chemicals
The table below shows some key statistics in the distribution of detectable levels of PFAS chemicals in the US. Note that 100% of locations with detectable levels of PFOA and PFOS had measurements beyond the MCL of four parts per trillion. The public health implication of this statistic is that PFOA and PFOS distribution in the US is bimodal (meaning that in areas where PFAS in the US occurs, it always happens at levels dangerous to human health, as determined by the MCL).
America’s typical PFAS and PFOS measurement is about 50% higher than the MCL value of 4 ppt, underscoring our earlier point regarding public policy responses based on these measurements.
Below, we’ve created a visual representation of the distribution of forever chemical measurements. While the typical value is close to the MCL, it is clear that an unacceptably large percentage of the measurements are 50% to 100% larger than the respective MCLs for each contaminant.
PFAS in the US is Pervasive. UCMR 5 Findings Can Help Dictate Future Regulations
The information we’re getting from UCMR 5 findings suggests that both public and private organizations need to plan for a future requiring PFAS in the US’s removal capabilities. With forever chemicals prevalent in public water systems – and often at MCL of four parts per trillion or more – organizations will need to protect themselves from liability, non-compliance, and financial concerns, among other issues.
KETOS is planning for the future of PFAS regulation in the US by working to add PFAS to its list of parameters organizations can test for. To be the first to know when KETOS SHIELD has PFAS monitoring capabilities, sign up to receive the latest updates.
Gain Insights on PFAS with KETOS
To answer questions surrounding PFAS, its concentrations, and what geographic and demographic data can reveal, we’ve used our new KETOS PRISM tool to build out a comprehensive report based on the PFAS dataset we’ve compiled. KETOS’ comprehensive report goes deep into high-level findings and provides quantitative insights into aspects of PFAS contamination, such as:
- The number of locations sampled and the number of locations with PFOA and PFOS levels above the EPA limit
- The locations where the highest levels of each type of regulated PFAS chemical in the US were recorded, and the individual measurements at these locations
- The geographic distribution of PFAS measurements in the US and a breakdown of states with the highest PFAS measurement incidences as well as states with the highest percentage of population potentially exposed to PFAS
- A detailed statistical analysis of the correlation between industry type and PFAS incidence to determine which industries have the highest correlation to PFAS incidence.
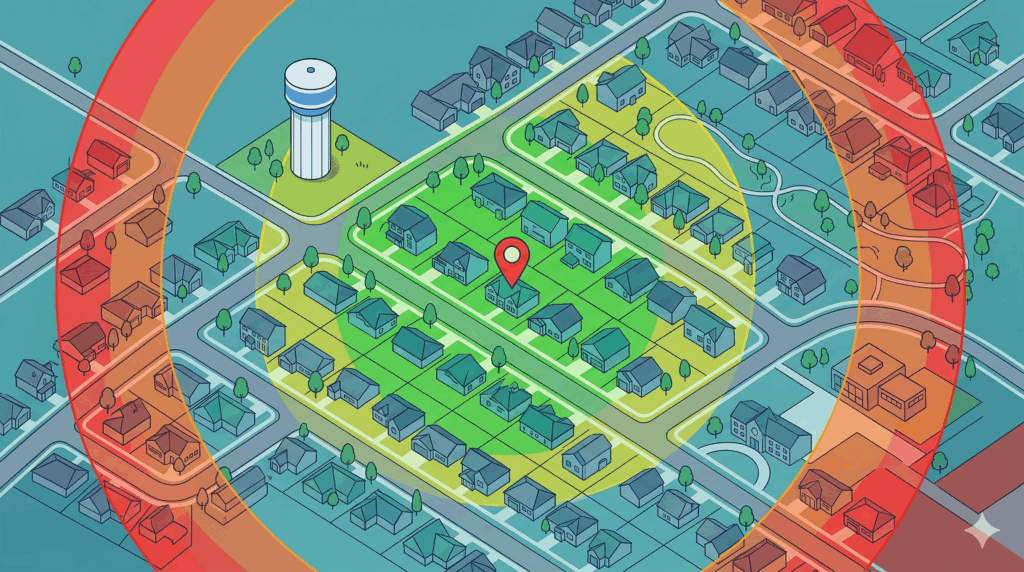
KETOS also provides a free tool called the PFAS Proximity Finder as a Service (PFaaS) tool to assist individuals and businesses in determining their potential level of PFAS risk based on the research included in the report. You can find the report, dataset, and tool here.