

One Monitoring Device, Two Jobs: How Cincinnati MSD Turned Plant Operations Into Enforcement
In 2024, the Los Angeles Dodgers signed Shohei Ohtani to hit. He was recovering from elbow surgery, so pitching was off the table. He responded by batting .310 with 54 home runs and 59 stolen bases, becoming the first player in history to join the 50/50 club.
Then in 2025, the elbow healed and Ohtani started pitching again on top of hitting: 14 starts, a 2.87 ERA, 62 strikeouts, and another 55 home runs, all without the Dodgers adding a roster spot or renegotiating his contract. He won his third consecutive unanimous NL MVP because the Dodgers already had a player who could do both jobs.
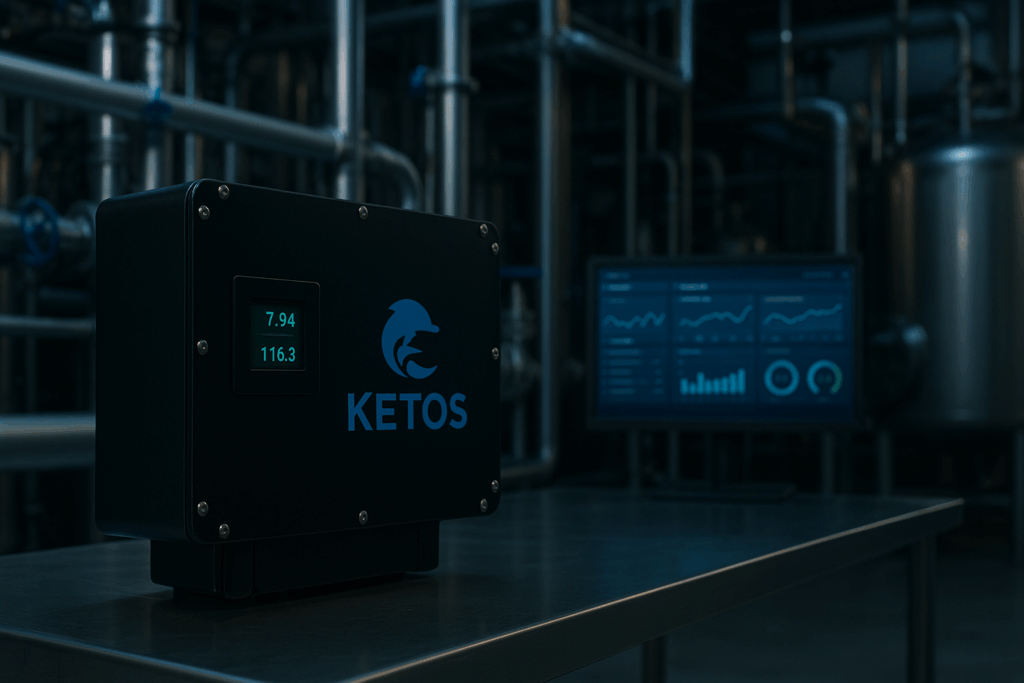
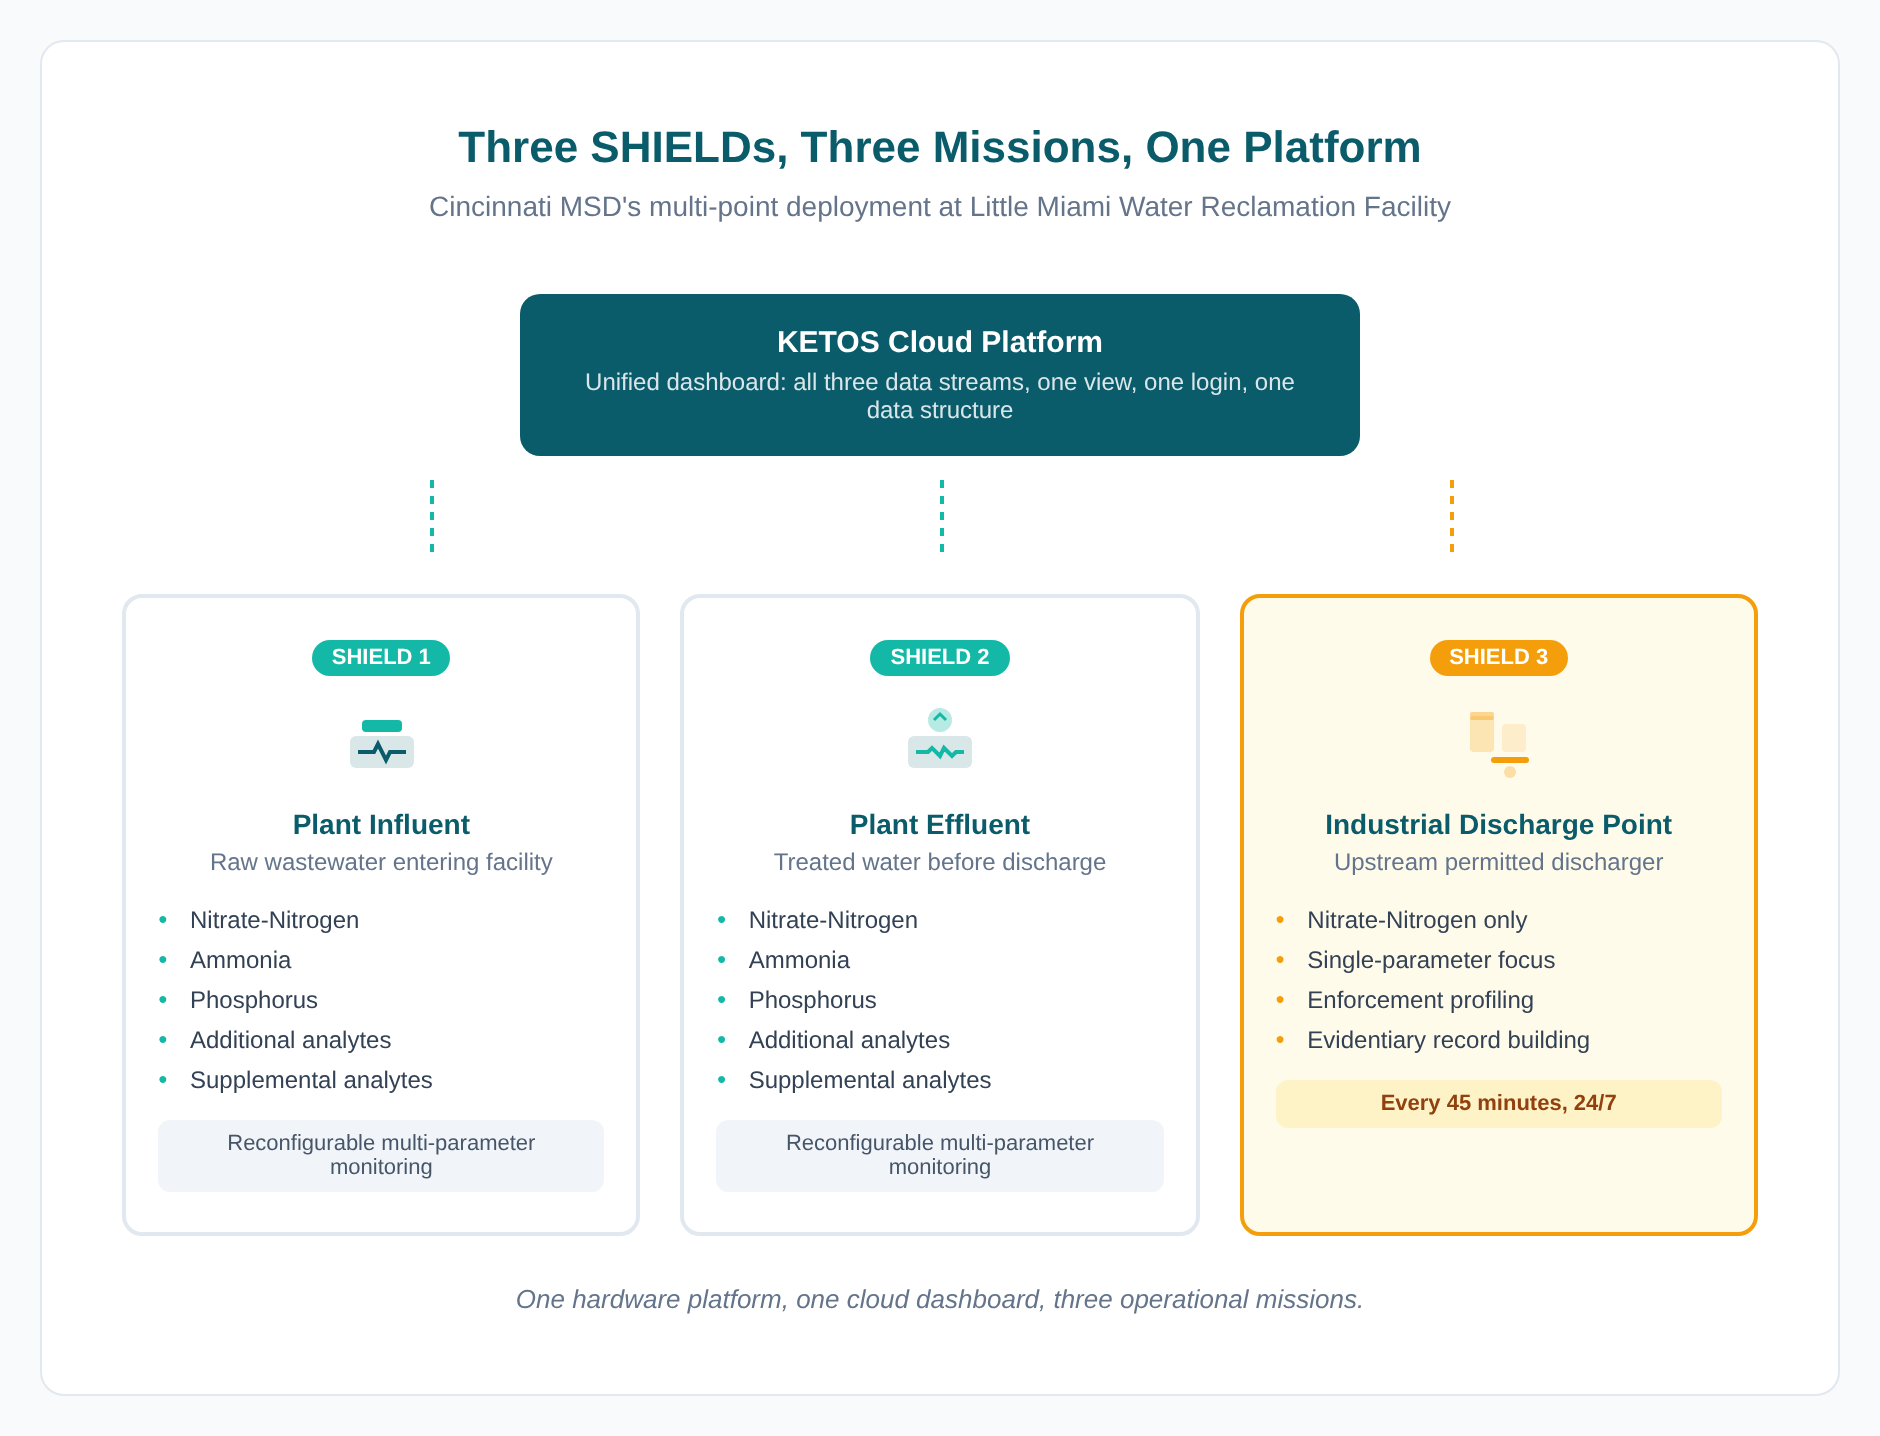
Cincinnati’s Metropolitan Sewer District found the same principle applied to their water monitoring equipment. In mid-2024, MSD deployed KETOS SHIELD units at their Little Miami Water Reclamation Facility for continuous water quality monitoring of the plant’s influent and effluent. Because SHIELD can be reconfigured to monitor multiple parameters on the same equipment at no additional cost, MSD was running nitrate-nitrogen, ammonia, and phosphorus panels across two units: one on the raw incoming wastewater, one on the treated outflow. The system replaced quarterly grab sampling with real-time, multi-parameter data, and it did the job well.
Then the data surfaced a problem that grab samples had never been able to pin down. One of MSD’s permitted industrial dischargers appeared to be contributing disproportionate nitrogen loading to the collection system. The discharges were batch-driven and irregular, which meant quarterly sampling couldn’t capture the actual pattern. MSD had suspicions but no quantifiable evidence for a surcharge case.
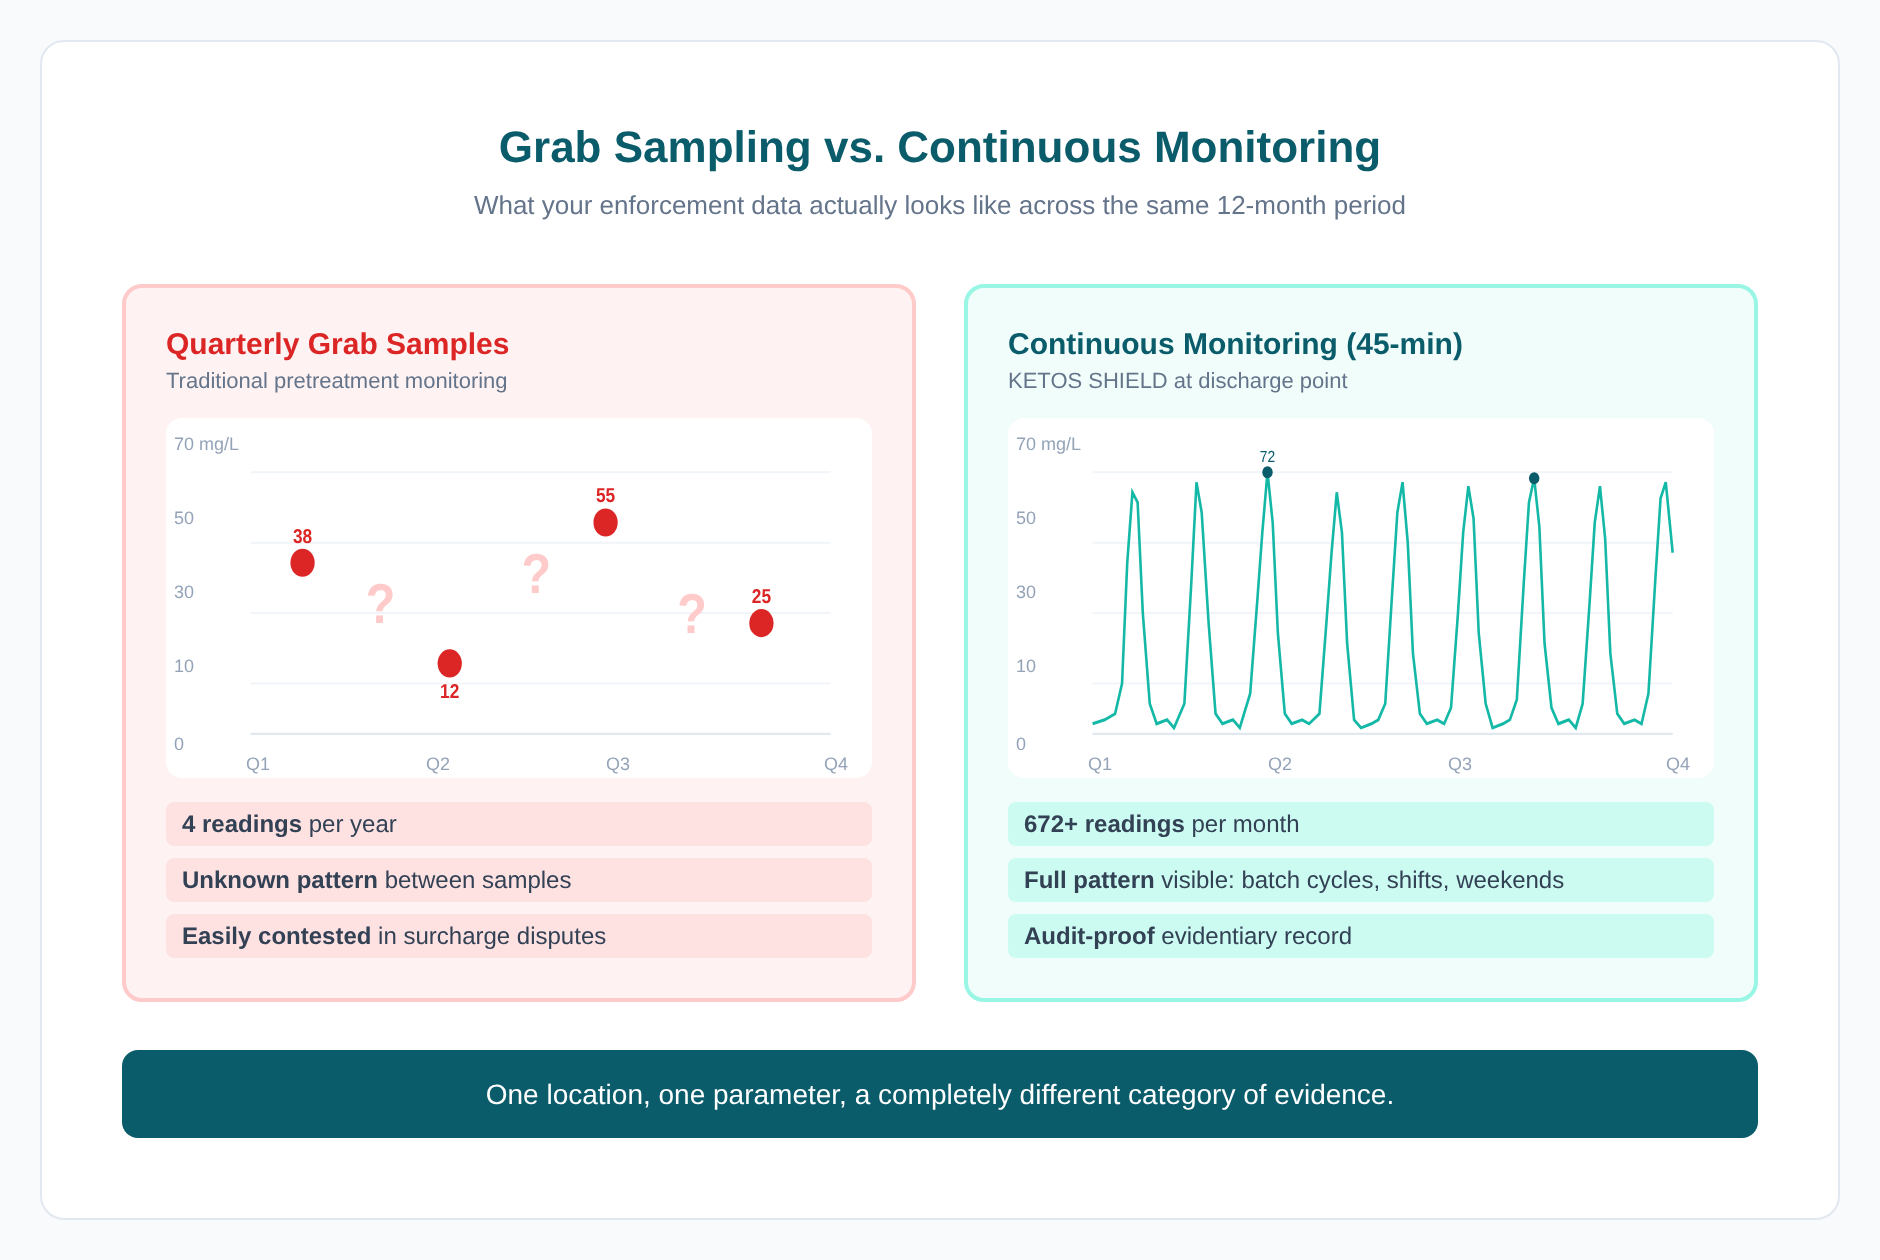
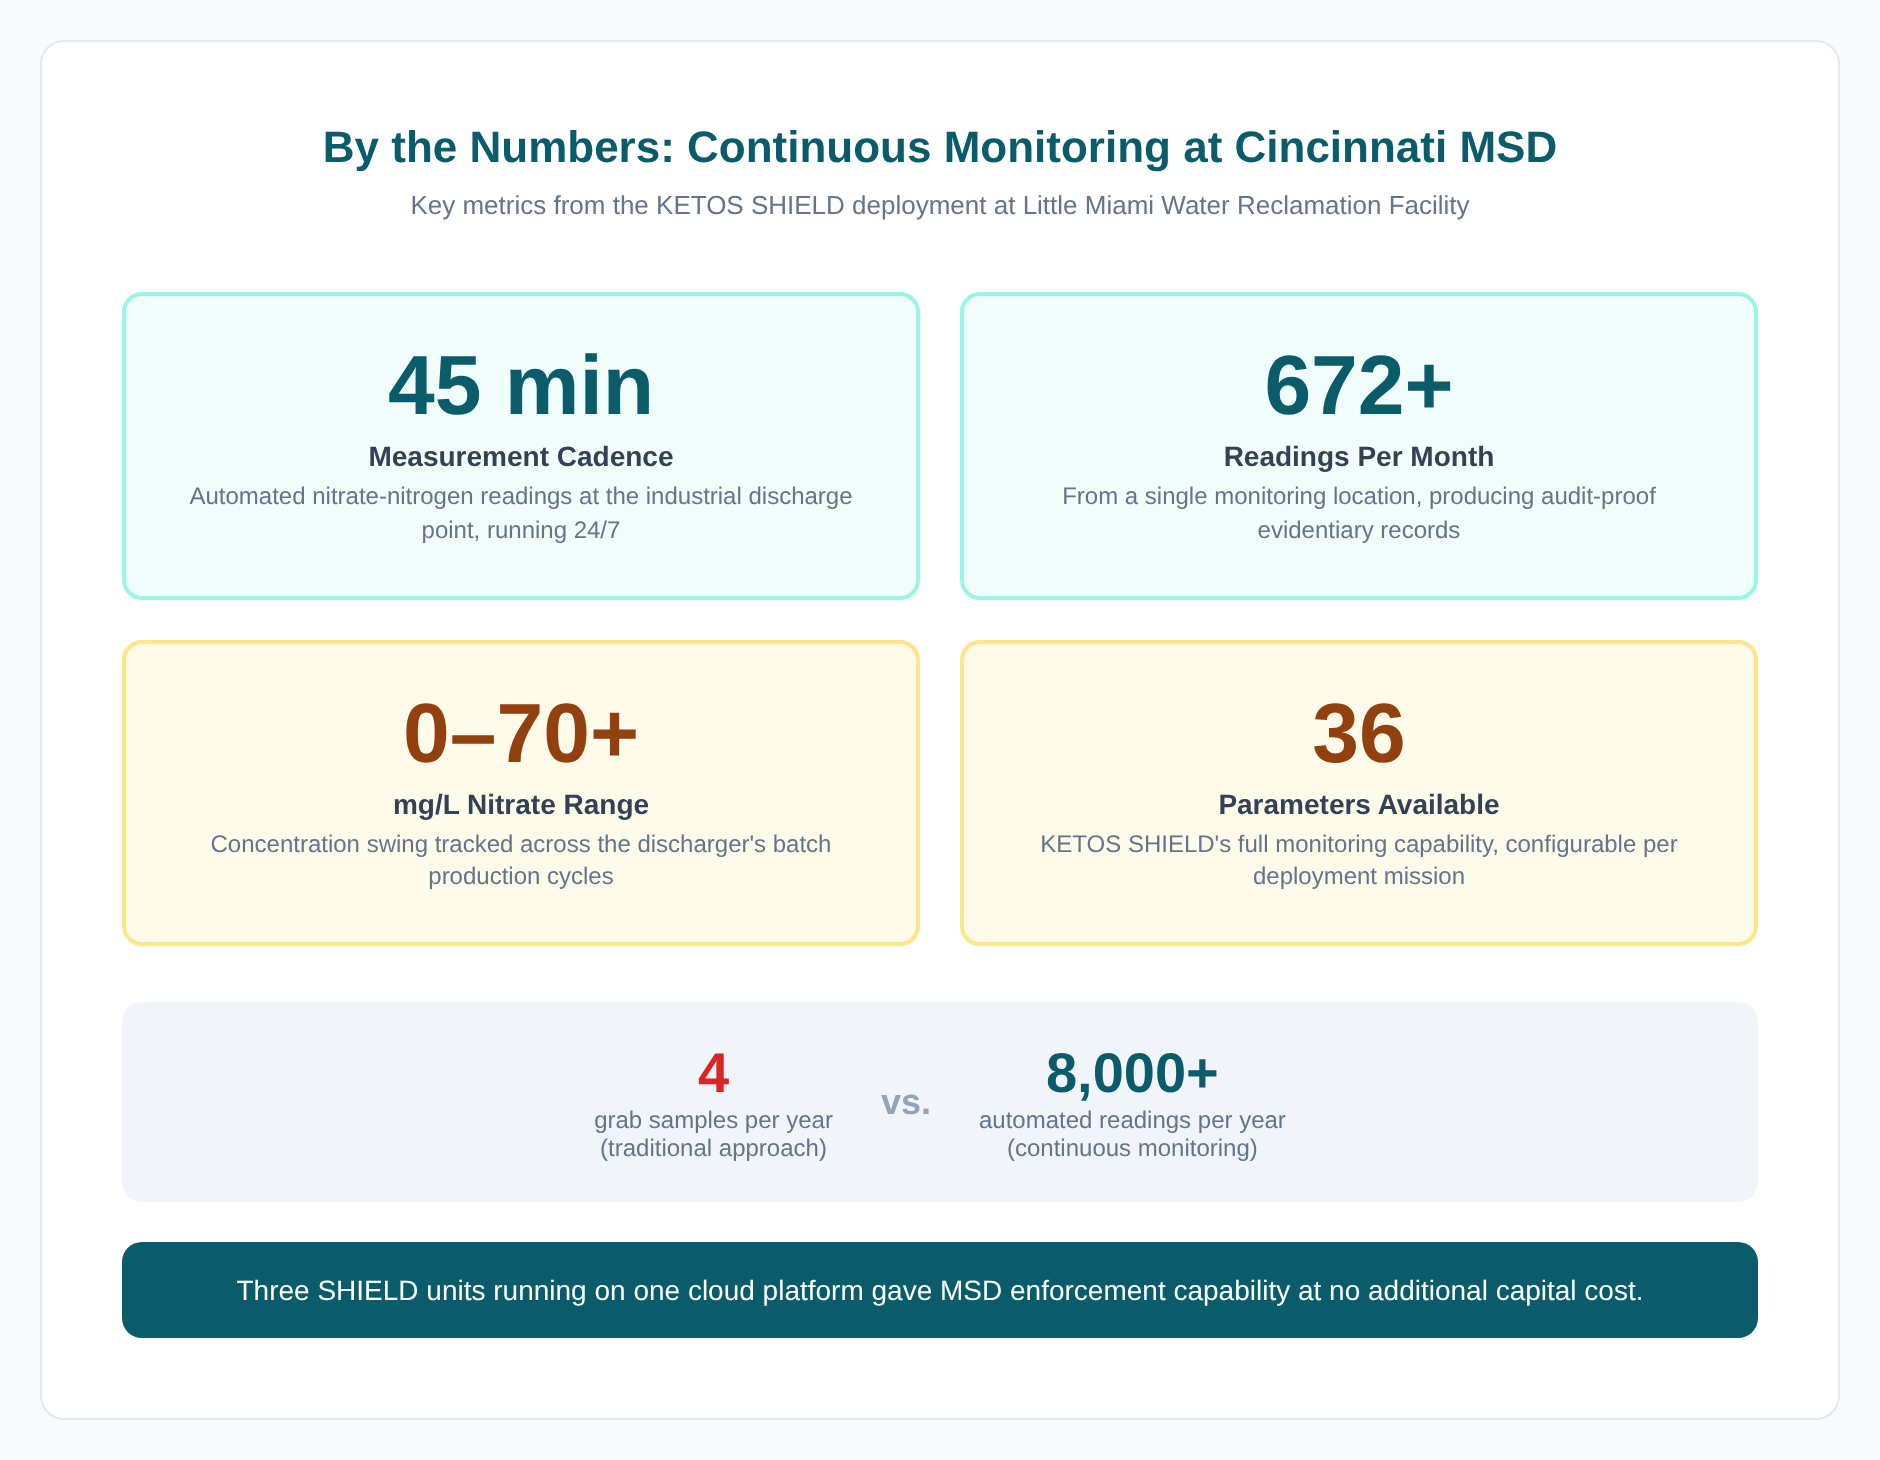
So they did what the Dodgers did with Ohtani: they gave the same asset a second mission. MSD moved a third SHIELD unit to the industrial discharger’s discharge point and left it there, monitoring nitrate every 45 minutes, 24/7. Within weeks, they had a time-series record showing nitrate concentrations ranging from 70+ mg/L down to near-zero, tracking directly with the customer’s production cycles.
The enforcement capability came from hardware MSD had already purchased for plant operations, running on the cloud platform they were already using, at no additional capital cost.
Why is water quality monitoring important? Because grab samples have a deadline problem.
Most utilities know that industrial pretreatment programs depend on grab sampling. You send someone out to the discharge point, collect a bottle, ship it to the lab, wait a week for results, cross-reference it to discharge permits, and bill accordingly. It’s the industry standard.
Grab sampling is also a game of luck. If the industrial discharger operates on a batch cycle, your sample might hit clean water or filthy water depending on when you happen to show up. Run the sample once a quarter, and the chance of capturing actual peak loading is low.
Continuous water quality monitoring changes that equation. Instead of a handful of discrete data points per year, you get hundreds of readings per week. The industrial operator can’t escape it through timing. The pattern becomes visible, the average becomes defensible, and surcharge billing becomes mathematically sound.
For MSD, this wasn’t a marginal improvement. The difference between four quarterly grab samples and dozens of continuous readings per week is the difference between a billing estimate and a regulatory record.
From plant operations to enforcement: the redeployability play
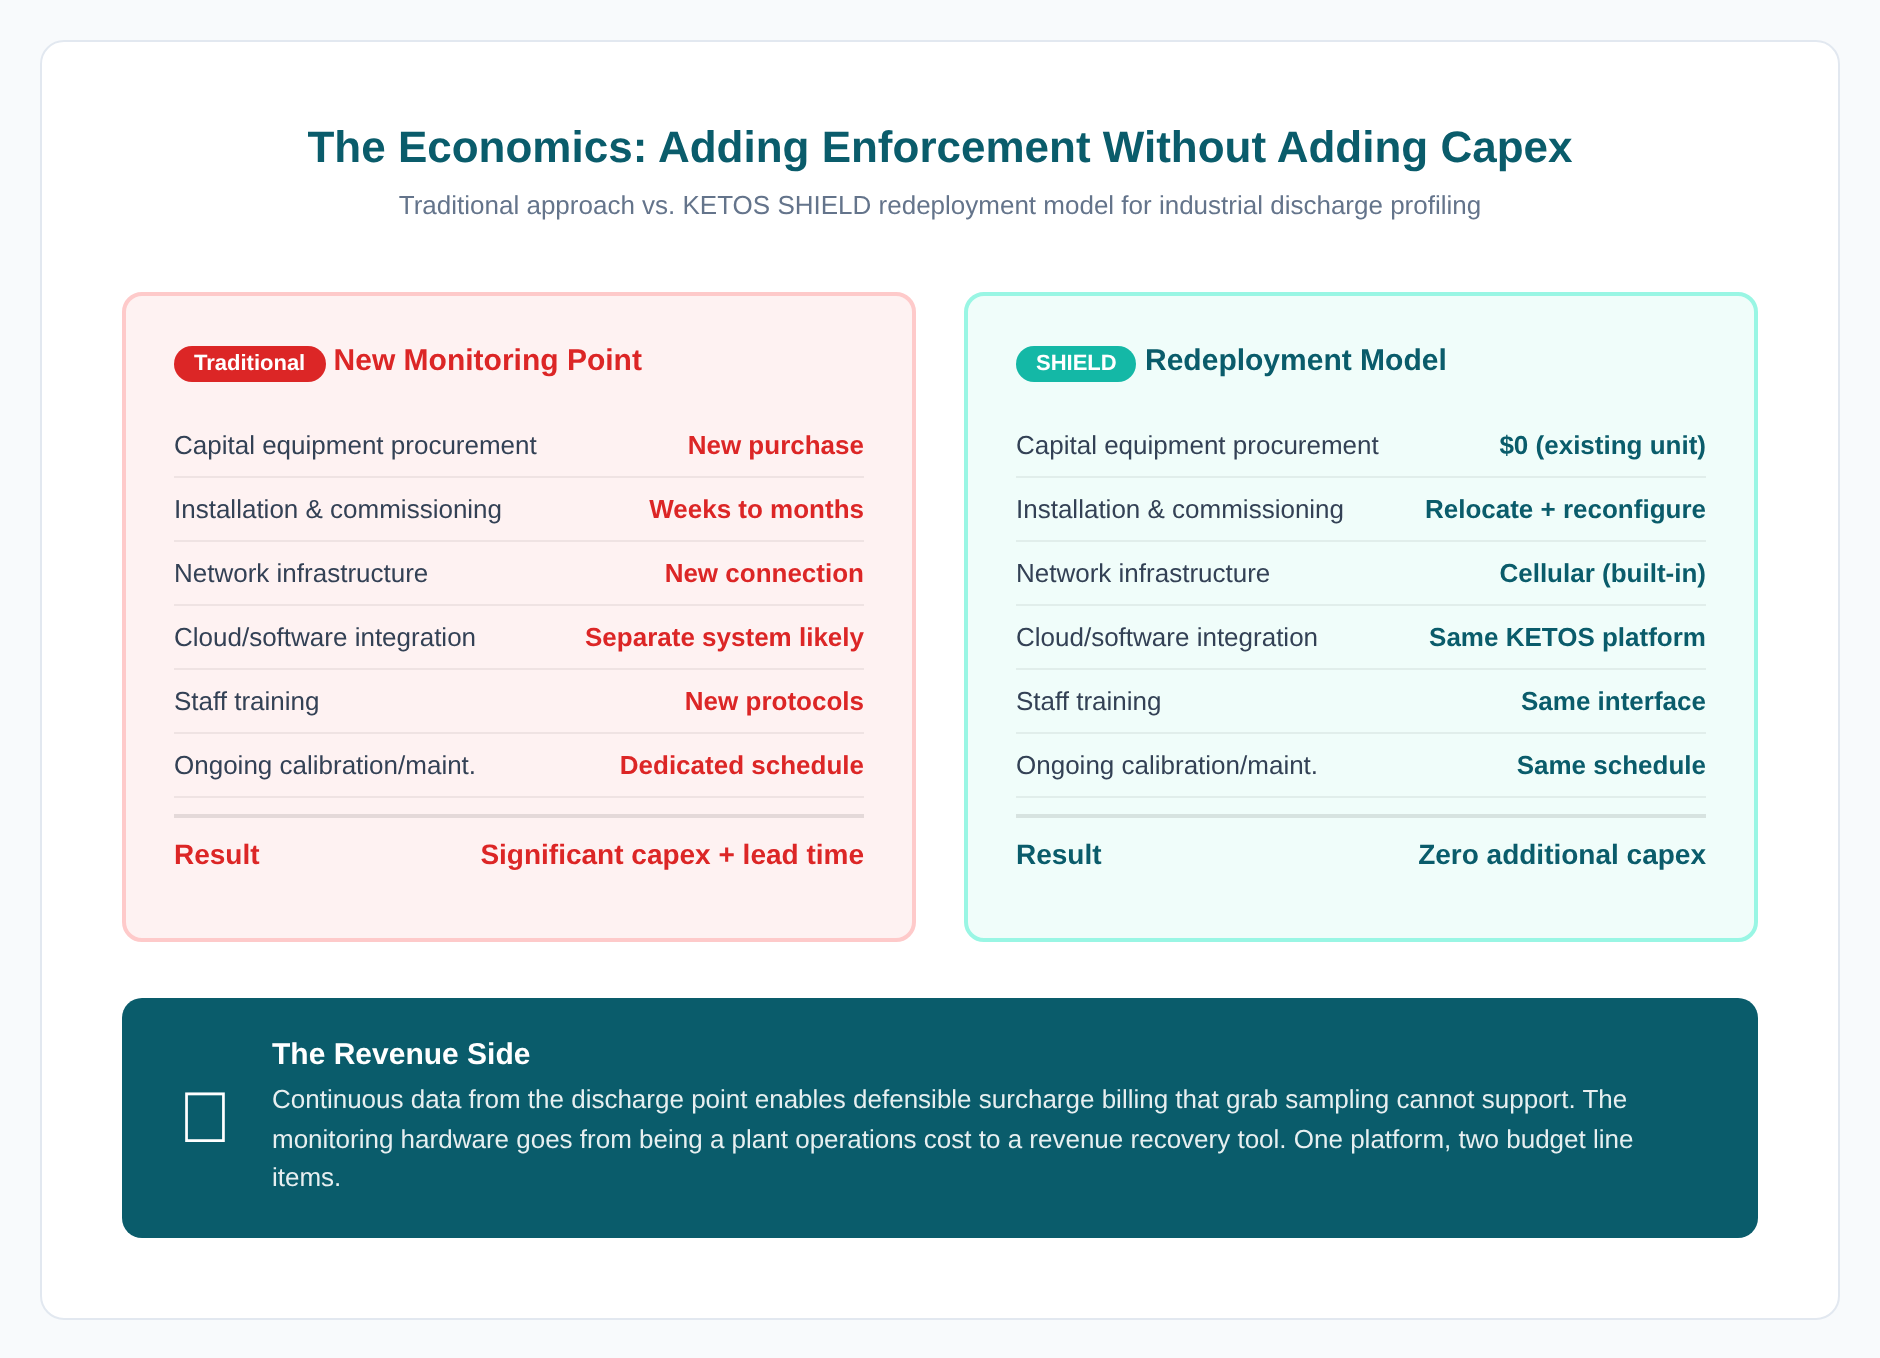
What makes the Cincinnati story worth studying is less about the monitoring technology and more about what it means for utility budgets. MSD started with two SHIELD units characterizing the full wastewater stream to optimize treatment, with one positioned upstream and the other downstream running configurable multi-parameter panels.
When the industrial nitrate problem became apparent, they didn’t order new hardware. They reconfigured one of the existing units, moved it to the discharge point, and set it to monitor a single parameter at high frequency. Adding a third monitoring point at an industrial discharge site would normally trigger a capital equipment purchase, installation costs, and network infrastructure, but MSD avoided all of that by redeploying a device that was already integrated into their cloud platform. The only cost was reconfiguration and deployment time. (For a detailed breakdown of how continuous monitoring economics compare to traditional lab testing and capital equipment purchases, see the ROI math behind automated water quality monitoring.)
For utilities with hundreds of permitted industrial users, this is a framework worth replicating. Deploy SHIELD for plant-wide operations first. Use the same hardware to profile high-priority discharge points. Rotate monitoring across industrial users based on risk or billing priority. Build time-series evidence for surcharge negotiations without buying additional monitoring infrastructure.
Need real-time water quality monitoring?
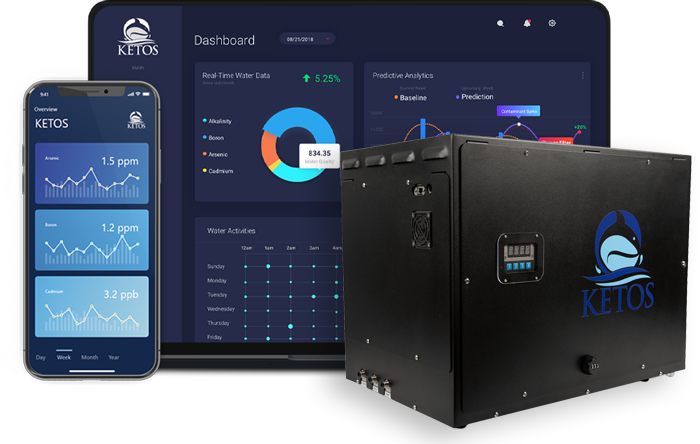
KETOS SHIELD continuously monitors 30+ parameters — replacing manual testing with automated, lab-accurate data.
Schedule a Demo →The nitrogen mass balance: seeing what goes in versus what comes out
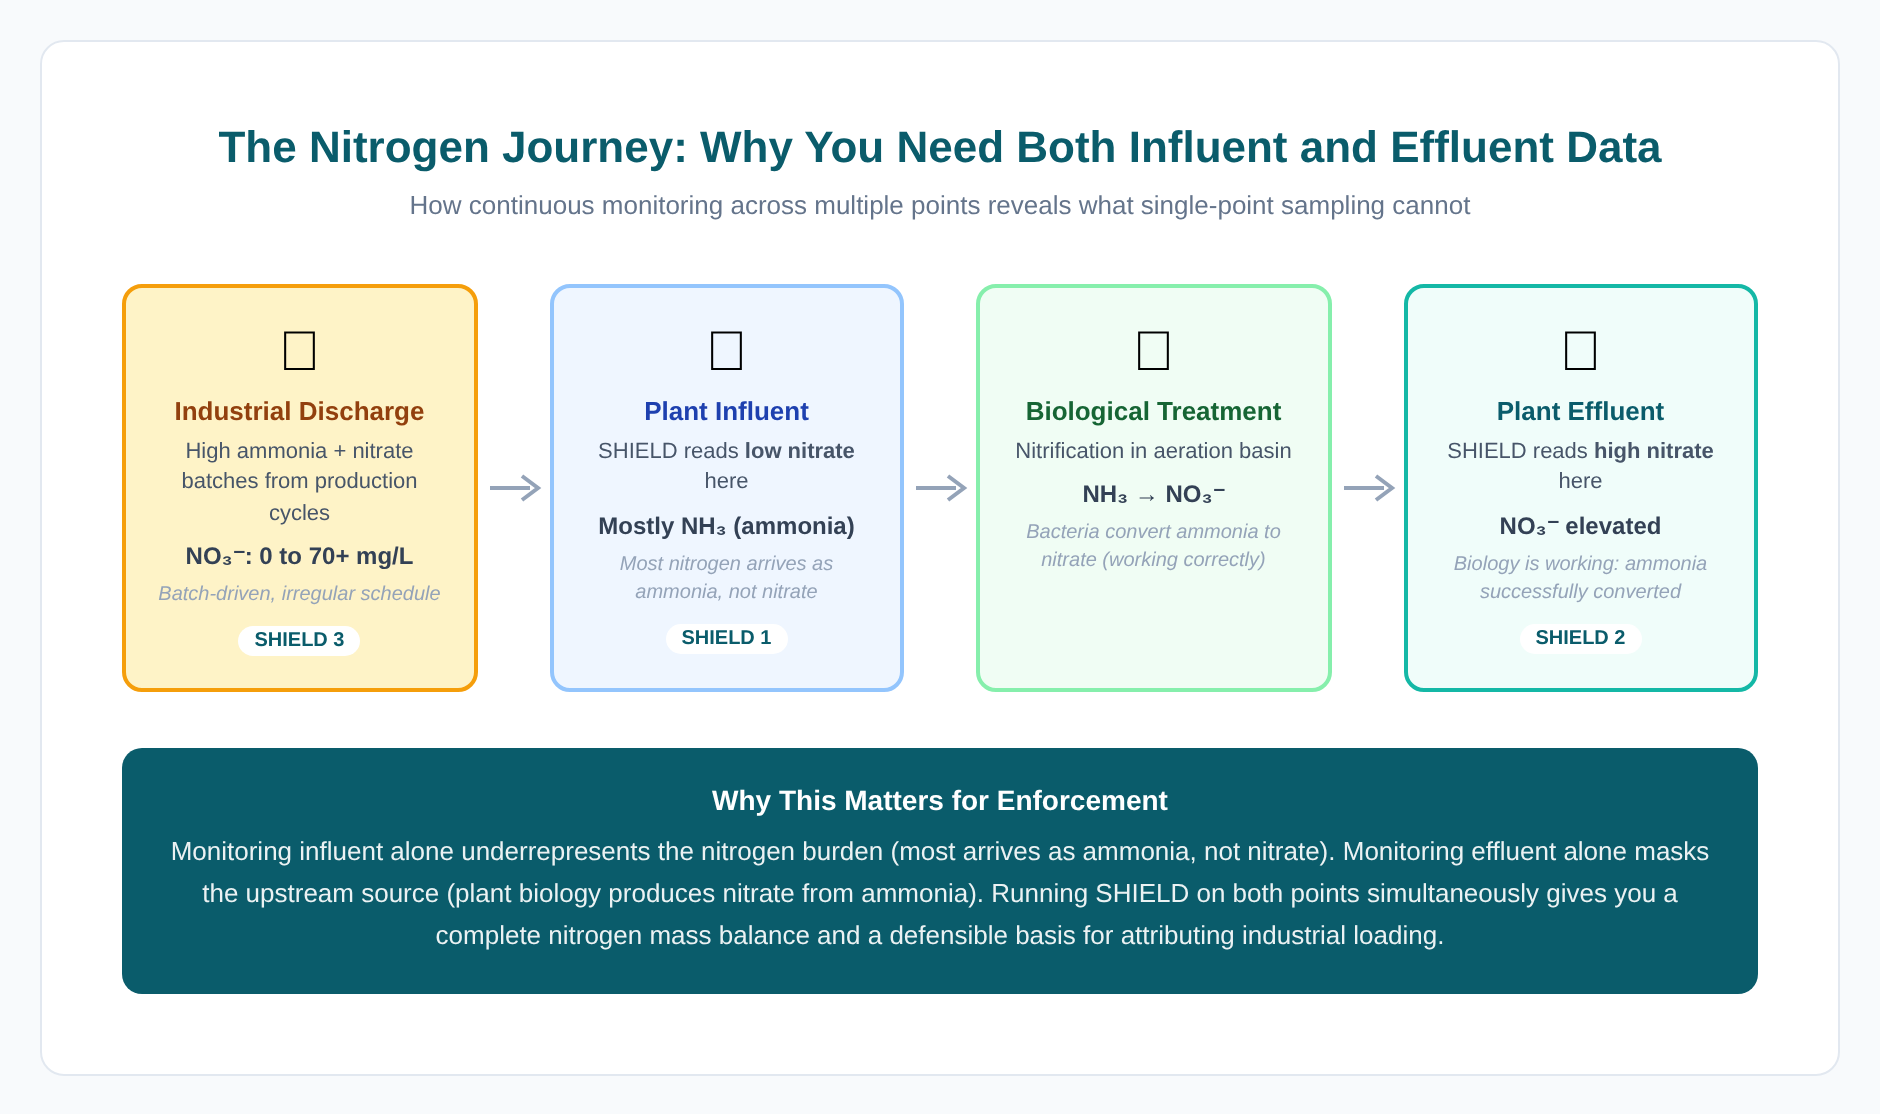
The continuous data also revealed something about plant biology that strengthened the enforcement case. Plant operators know that influent nitrogen often arrives as ammonia. The wastewater treatment process converts that ammonia to nitrate through nitrification in the aeration basin. By running continuous monitoring on both the raw influent AND the post-treatment effluent simultaneously, MSD could see the complete nitrogen mass balance.
Influent nitrate readings were low while effluent nitrate readings were high. The explanation is textbook wastewater biology: the plant’s aeration basin converts incoming ammonia to nitrate through nitrification. So high effluent nitrate meant the biology was working correctly, not that treatment was failing. But it also meant that some of the effluent nitrate was plant-generated from incoming ammonia, not simply passed through from industrial sources.
When MSD monitored the industrial discharge point directly, they could separate the customer’s 70+ mg/L nitrate batches from the plant’s biological baseline, and the difference became the customer’s liability. Because all three monitoring points (influent, effluent, and industrial discharge) reported through the same KETOS cloud system, the data lived in one place and the relationships between upstream loading, plant biology, and downstream impact were visible without additional integration work. Billing the customer for the documented impact required no extrapolation or estimation.
Building an evidentiary record that holds up in enforcement
Grab sampling has another structural problem beyond timing: it’s easily contested.
If a utility bills an industrial customer based on four quarterly samples, the customer’s lawyer will argue those samples aren’t representative. The samples could be contaminated, the method could be wrong, or the timing could be unlucky. With limited data, there’s room for doubt.
Continuous monitoring at 45-minute intervals generates 672 data points per month from a single location. After three months, that’s over 2,000 readings. No reasonable argument about unrepresentative sampling survives that volume of evidence.
This is why MSD’s third SHIELD unit functioned as enforcement infrastructure. The data was so dense and regular that it became difficult to challenge in an audit. In conversations with the industrial customer about surcharges, neither party could dispute what the equipment had observed. The pattern was too consistent, too extensive, and too clearly correlated with the customer’s operational schedule.
For utilities working through pretreatment compliance negotiations, this kind of evidence shifts the conversation. Instead of debating whether four grab samples represent reality, both parties are working from a time-series record that’s documentable, repeatable, and hard to challenge.
Why MSD’s approach replicates across industrial programs
Cincinnati MSD manages hundreds of permitted industrial dischargers. What they proved with one SHIELD unit and one surcharge case is that continuous monitoring hardware serves multiple operational purposes from a single procurement.
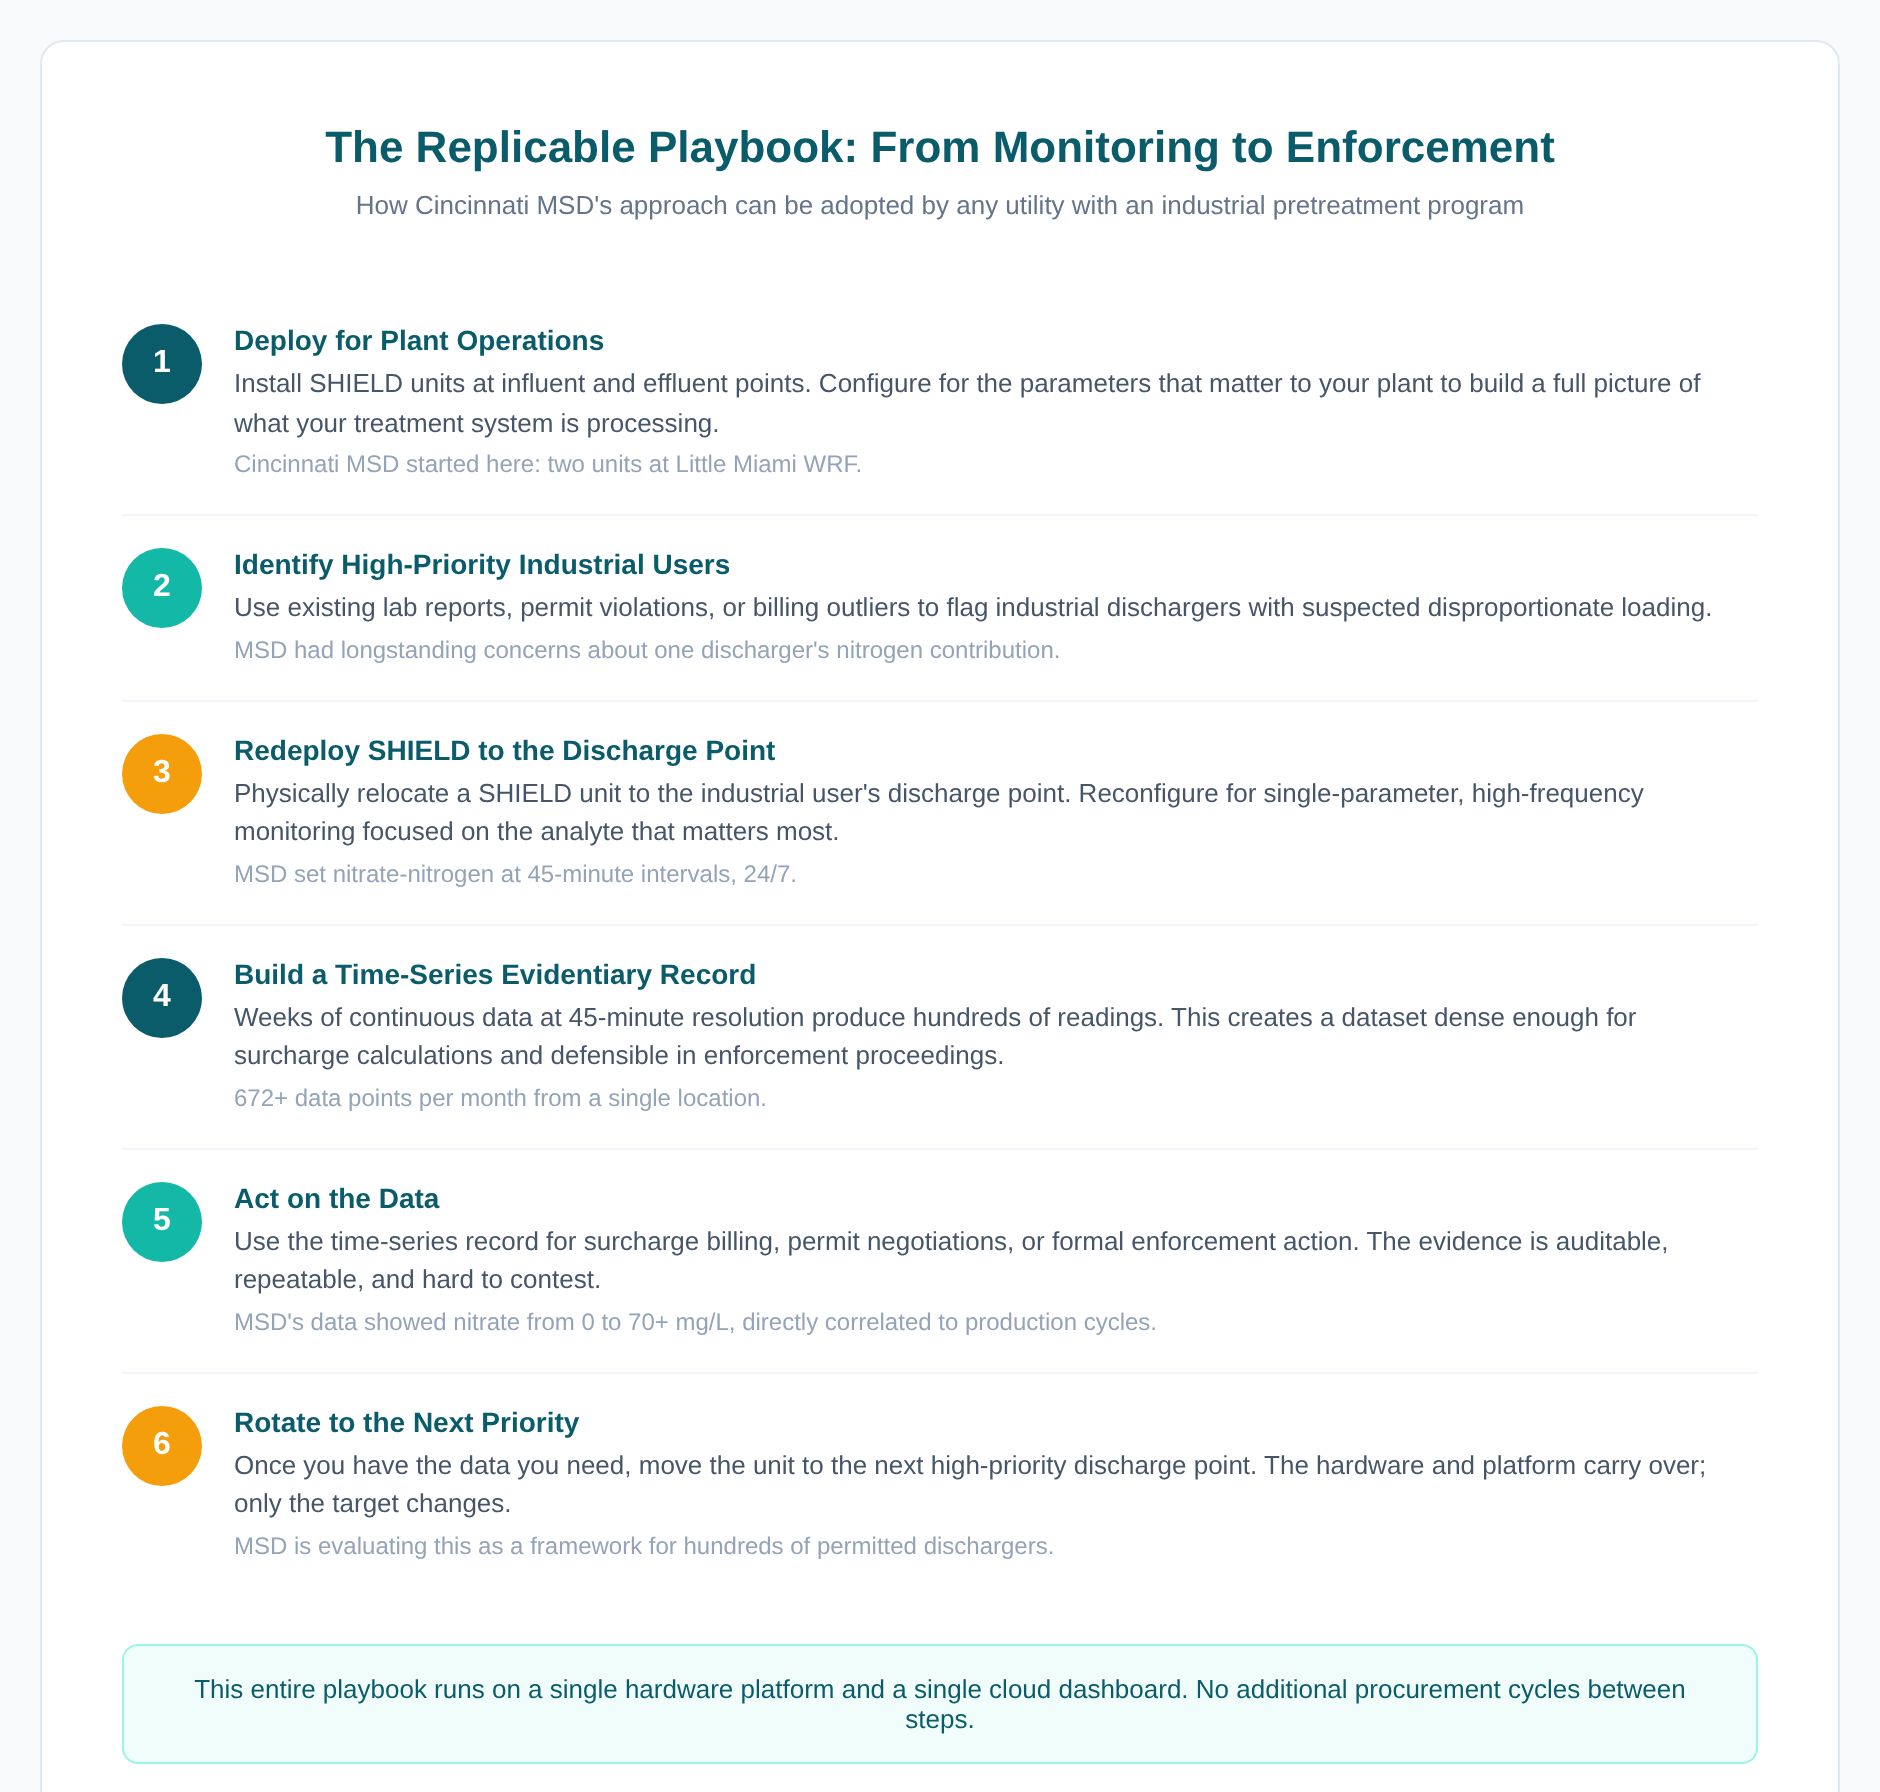
The playbook that emerges from Cincinnati’s experience has six steps. First, deploy SHIELD units for baseline plant operations across influent and effluent to build a full picture of what your treatment system is processing. Second, identify industrial users with suspected disproportionate loading based on lab reports, permit violations, or billing outliers. Third, redeploy a SHIELD unit to the discharge point and reconfigure it for the parameter that matters most (in Cincinnati’s case, nitrate) at high frequency, 24/7, for a defined period. Fourth, let the continuous data accumulate into a time-series record, since weeks of continuous data at 45-minute intervals produce a far more complete picture than years of grab samples. Fifth, use that record for surcharge billing, permit negotiations, or formal enforcement action. Sixth, once you have the data you need, move the unit to the next priority discharge point and repeat.
The replicability comes from hardware that does one thing well (monitor a single parameter, reliably, over time), is physically portable, and integrates into a single platform. MSD didn’t need separate systems for influent monitoring, effluent monitoring, and industrial enforcement. They used one platform, one interface, and one data structure across all three.
For utilities operating lean pretreatment teams, this matters. You get enforcement-grade evidence without doubling your instrumentation budget.
Monitoring hardware doesn’t have to live in one place
Most utilities buy monitoring equipment, install it in a specific location for a specific purpose, and get value from that installation indefinitely. MSD did the same, but then realized the same hardware could solve an entirely different problem at a different location because the cost of moving it and reconfiguring it was low enough that the economics worked, and the evidence it generated paid for the decision.
If you’re managing industrial pretreatment programs, or if your utility bills surcharges based on loadings, the Cincinnati framework offers a different way to think about capital expenditure. A single continuous monitoring platform like KETOS SHIELD can fund multiple missions across operations, compliance, and revenue recovery without requiring separate procurement cycles for each one.
To see how KETOS SHIELD performs in multi-point, multi-mission deployments like Cincinnati’s, visit the SHIELD product page. To quantify what continuous monitoring could save your facility in lab fees, labor, and compliance exposure, run your numbers through the ROI calculator. Or schedule a consultation to discuss how a redeployable monitoring platform could change your pretreatment program’s economics.
Frequently Asked Questions
What is continuous water quality monitoring and how does it differ from grab sampling?
Continuous water quality monitoring uses automated sensors to measure water parameters at regular intervals (typically every 15 to 60 minutes) around the clock. Grab sampling, by contrast, involves manually collecting a water sample at a single point in time, usually once per quarter, and sending it to a lab. Continuous monitoring produces hundreds of readings per week compared to four per year from grab sampling, making it far more effective at capturing irregular discharge patterns from industrial sources.
How did Cincinnati MSD use KETOS SHIELD for industrial enforcement?
Cincinnati’s Metropolitan Sewer District deployed KETOS SHIELD units at their Little Miami Water Reclamation Facility for plant influent and effluent monitoring. When continuous data revealed irregular nitrogen loading from an industrial discharger, MSD redeployed a third SHIELD unit to the discharge point. The unit monitored nitrate every 45 minutes, generating a time-series record that showed concentrations ranging from near-zero to over 70 mg/L, correlated with the discharger’s production cycles. This data became the evidentiary basis for surcharge billing.
What does it cost to add a new monitoring point with KETOS SHIELD?
Because KETOS SHIELD units are reconfigurable and run on a shared cloud platform, adding a new monitoring point does not require a new capital equipment purchase. MSD redeployed an existing unit to a new location and reconfigured it for a single parameter (nitrate) at no additional capital cost. The only expense was the time required to relocate and reconfigure the device, avoiding typical costs for procurement, installation, network infrastructure, and software integration.
How many parameters can KETOS SHIELD monitor?
KETOS SHIELD can monitor up to 36 water quality parameters, including nitrate-nitrogen, ammonia, phosphorus, conductivity, pH, and heavy metals. The panels are configurable per deployment, meaning the same hardware can be reconfigured to monitor different parameters for different missions without additional equipment purchases.
Why is continuous monitoring data stronger than grab samples for enforcement?
Continuous monitoring at 45-minute intervals generates approximately 672 data points per month from a single location. Over three months, that accumulates to more than 2,000 readings. This volume of data is difficult for industrial dischargers to contest as unrepresentative. By contrast, four quarterly grab samples leave significant room for legal challenge on grounds of timing, contamination, or sampling methodology.