Corrosion silently eats away at industrial infrastructure every minute, transforming essential metal components into rust and disrupting operations across every sector. According to NACE International’s IMPACT study, this invisible enemy costs industry $2.5 trillion annually – a staggering 3.4% of global GDP. Yet implementing proper corrosion monitoring and prevention could save industries $375 – $875 billion of these losses. This represents a crucial opportunity for industrial facilities: while corrosion poses one of the most persistent challenges to many industries, it can be effectively managed through proper water quality monitoring and control.
What is Corrosion in Industrial Water Systems
Corrosion in industrial water systems occurs when metal pipes and equipment react with the oxygen that is present in water. This reaction becomes particularly aggressive in systems with stagnant or low-mineral water content. The process typically manifests through:
- Brown coloration in water;
- Visible surface deterioration;
- Material erosion;
- Rust accumulation in low-flow areas; and
- Pitting in severe cases.
The Critical Role of LSI Monitoring
The Langelier Saturation Index (LSI) stands as industry’s most reliable predictor of water’s corrosive behavior. This sophisticated calculation acts as an early warning system, indicating whether water will corrode metal surfaces or deposit protective scale layers. For facility managers and engineers, LSI monitoring provides actionable insights into their system’s corrosion risk before damage occurs.
The Five Essential Parameters of LSI
LSI calculation relies on five key measurements that interact to determine water’s corrosive potential. Each parameter must be monitored precisely for accurate assessment.
| Parameter | Description | Impact on Corrosion |
| pH Level | Scale of 0-14 measuring acidity/alkalinity | < 7.0: Increases corrosion risk
> 7.0: Promotes scale formation |
| Temperature | Water temperature in system | Higher temperatures accelerate corrosion rates |
| Calcium Hardness | Concentration of dissolved calcium ions | Adequate levels form protective scale layers |
| Total Alkalinity | Acid neutralizing capacity | Buffers against corrosive pH changes |
| TDS | Total Dissolved Solids content | High levels increase conductivity and corrosion risk |
LSI Value Interpretation Guide
LSI readings provide immediate insight into system conditions and necessary corrective actions. Here’s what different values indicate for your water system:
| LSI Range | Water Condition | Required Action |
| < -0.5 | Severe corrosion potential | Immediate corrective action required |
| -0.5 to 0 | Mild corrosion potential | Adjustment recommended |
| 0.1 to 0.3 | Optimal condition | Maintain current parameters |
| 0.3 to 0.5 | Mild scale forming | Monitor closely |
| > 0.5 | Strong scale forming | Adjustment required |
Real-Time LSI Monitoring Benefits
Modern automated monitoring systems provide continuous LSI calculation, offering several advantages:
- Early detection of corrosive conditions before damage occurs;
- Immediate notification when parameters drift outside optimal ranges;
- Data trending to identify patterns and predict potential issues;
- Optimization of chemical treatment programs; and
- Documentation for regulatory compliance.
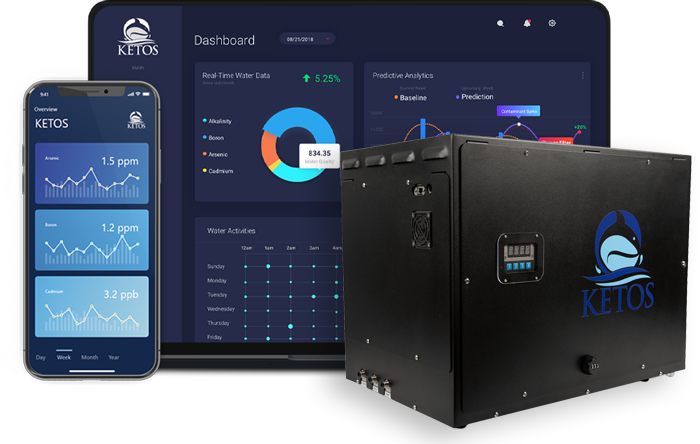
Maintaining proper LSI values requires consistent monitoring and rapid response to changing conditions. Advanced monitoring systems like KETOS SHIELD provide real-time LSI calculations, enabling proactive management of corrosion risk through automated sampling and analysis.
LSI Calculation and Implementation
The Langelier Saturation Index requires specific calculations based on measured water parameters. Understanding this process enables accurate system monitoring and timely interventions.
LSI Calculation Method
LSI = pH – pHs
Where pHs = (9.3 + A + B) – (C + D)
| Factor | Parameter | Calculation |
| A | TDS Factor | [(Log₁₀(TDS) – 1) / 10] |
| B | Temperature Factor | [13.12 x Log₁₀(°C + 273) – 34.55] |
| C | Calcium Hardness Factor | Log₁₀[Ca²⁺ as CaCO₃] |
| D | Alkalinity Factor | Log₁₀[Alkalinity as CaCO₃] |
Example Calculation
Using these water parameters:
- pH = 7.5
- TDS = 320 mg/L
- Calcium = 150 mg/L as CaCO3
- Alkalinity = 34 mg/L as CaCO3
At 25°C (Room Temperature):
- A = (Log10[320] – 1)/10 = 0.15
- B = -13.12 × Log10(25 + 273) + 34.55 = 2.09
- C = Log10[150] – 0.4 = 1.78
- D = Log10[34] = 1.53
- pHs = (9.3 + 0.15 + 2.09) – (1.78 + 1.53) = 8.2
- LSI = 7.5 – 8.2 = -0.7
Result: No tendency to scale
At 82°C (Elevated Temperature):
- A = (Log10[320] – 1)/10 = 0.15
- B = -13.12 × Log10(82 + 273) + 34.55 = 1.09
- C = Log10[150] – 0.4 = 1.78
- D = Log10[34] = 1.53
- pHs = (9.3 + 0.15 + 1.09) – (1.78 + 1.53) = 7.2
- LSI = 7.5 – 7.2 = +0.3
Result: Slight tendency to scale
Note: Temperature significantly impacts the LSI value, as demonstrated by the difference between room temperature and elevated temperature calculations.
LSI Reference Chart
The LSI reference chart provides a comprehensive guide for interpreting water conditions and determining appropriate actions. Each range corresponds to specific corrosion risks and scale formation potential, enabling quick assessment and response.
| LSI Value | Condition | Corrosion Risk | Scale Formation | Recommended Action |
| -2.0 or less | Severe corrosion | Very High | None | Immediate treatment required |
| -1.0 to -2.0 | Serious corrosion | High | None | Treatment required |
| -0.5 to -1.0 | Moderate corrosion | Moderate | Very Low | Treatment recommended |
| 0.0 to -0.5 | Light corrosion | Low | Low | Monitor system |
| 0.0 to 0.3 | Optimal balance | Very Low | Optimal | Maintain parameters |
| 0.3 to 0.5 | Light corrosion | Low | Low | Monitor system |
Essential Parameters Beyond LSI
While LSI is a primary indicator, effective corrosion prevention demands monitoring additional critical water quality parameters. Each parameter provides unique insights into system conditions and potential corrosion risks.
Primary Chemical Parameters
Chemical parameters form the foundation of water quality monitoring in corrosion prevention. These key indicators directly influence water’s corrosive potential and require precise monitoring for optimal system protection.
Dissolved Oxygen
Dissolved oxygen acts as a primary corrosion accelerator, so levels must remain below 20 ppb in most systems. Higher concentrations directly increase corrosion rates, making continuous monitoring critical for system protection.
Chlorine Residual
The optimal range of 0.5-1.5 ppm balances disinfection needs with corrosion control. Excessive chlorine levels can accelerate metal surface deterioration, particularly in copper and steel components.
pH Stability
Maintaining a pH between 7.2 – 8.5 is essential for corrosion control. Fluctuations outside this range can trigger corrosive conditions and accelerate metal degradation.
Electrical Conductivity
Electrical conductivity measures water’s ionic content and is considered managed between 100-3000 µS/cm. Higher conductivity increases corrosion risk by enhancing electrochemical reactions.
Heavy Metals
The presence of metals like iron, copper, and zinc often indicates active corrosion. Regular monitoring serves as an early warning system for system degradation.
Oxidation-Reduction Potential (ORP)
The target range of 150-250 mV indicates balanced conditions. ORP measurements reveal the water’s tendency to corrode or protect metal surfaces.
Physical Parameters
Physical parameters directly affect system dynamics and corrosion mechanisms. These measurable properties can accelerate or inhibit corrosion processes, making their monitoring essential for system integrity.
Temperature
System-specific ranges must be maintained as higher temperatures accelerate corrosion reactions and affect oxygen solubility. Continuous monitoring through temperature sensors enables precise control.
System Pressure
Pressure variations can lead to cavitation corrosion. Design-specific pressure ranges must be maintained through continuous monitoring with pressure transmitters.
Flow Rates
Optimal flow typically ranges between 3-5 ft/sec. Low flow encourages sediment accumulation and under-deposit corrosion, while high flow risks erosion corrosion. Flow meters provide essential monitoring.
Turbidity
Levels should remain below 1 NTU to prevent under-deposit corrosion. Suspended particles can create localized corrosion cells, requiring monitoring through online turbidity analyzers.
Integrated Parameter Monitoring
Modern water quality monitoring systems like KETOS SHIELD integrate measurement of these parameters into a single platform, providing:
- Real-time monitoring of all critical parameters;
- Correlation analysis between different measurements;
- Early detection of parameter interactions that may accelerate corrosion;
- Automated alerts when parameters exceed acceptable ranges; and
- Historical trending for predictive maintenance.
Understanding the relationship between these parameters enables more effective corrosion prevention strategies. When monitored together, these measurements provide a comprehensive view of system health and corrosion risk.
Economic Benefits of Real-Time Monitoring
Industrial facilities implementing automated water quality monitoring systems typically see returns on investment within 12-18 months. Beyond immediate cost savings, these systems fundamentally transform maintenance strategies from reactive to predictive, dramatically reducing long-term operational expenses. A single prevented system failure can often justify the up-front investment of an automated water quality monitoring system.
Investing in a quality system delivers substantial returns through:
- Extended Equipment Lifecycle: Proactive monitoring extends asset lifespan by 30-50%, reducing capital replacement costs and improving ROI on existing infrastructure.
- Reduced Maintenance Costs: Early detection eliminates 60-70% of emergency repairs, reducing labor costs and spare parts inventory requirements.
- Minimized System Downtime: Real-time monitoring prevents unplanned shutdowns, saving facilities an average of $10,000 – $50,000 per avoided incident in lost production.
- Lower Chemical Treatment Expenses: Precise monitoring enables optimal chemical dosing, typically reducing treatment costs by 15-25% through improved efficiency.
- Prevented Catastrophic Failures: Early warning systems help avoid major system failures that can cost facilities millions in repairs, regulatory fines, and production losses.
- Optimized Operational Efficiency: Data-driven insights enable facilities to operate closer to optimal conditions, reducing energy consumption and improving system performance.
Transform Your Water Management Today
The KETOS SHIELD platform revolutionizes industrial water monitoring by providing lab-accurate measurements across multiple parameters in real time. This comprehensive system enables:
- 24/7 automated monitoring;
- Instant alert notifications;
- Predictive maintenance insights;
- Integration with existing systems;
- Unlimited testing frequency; and
- Remote access to data.
For industrial facilities seeking to optimize their water quality monitoring and corrosion prevention strategies, KETOS offers a cutting-edge solution that combines advanced technology with practical application. Contact KETOS at Info@ketos.co or visit the KETOS website to schedule a demonstration and learn how automated water quality monitoring can protect your facility’s infrastructure and reduce your operational costs.
